Table of contents

TL;DR
A company’s design language may change, but the underlying logic of a strong board deck remains consistent. Each slide must answer a specific board-level question, establish a clear visual priority, and help the board understand, discuss, or decide something. This guide breaks down the purpose, layout, charts, metrics, and recurring patterns behind 14 core board deck slides, based on patterns we have seen while designing actual board presentations.

A company’s design language may change, but the underlying logic of a strong board deck remains consistent. Each slide must answer a specific board-level question, establish a clear visual priority, and help the board understand, discuss, or decide something. This guide breaks down the purpose, layout, charts, metrics, and recurring patterns behind 14 core board deck slides, based on patterns we have seen while designing actual board presentations.
Amélie Laurent
Product Manager, Sisyphus

A longer board deck does not create a better-informed board. In many cases, it does the opposite.
As more slides are added, the company’s actual position becomes harder to see. The executive summary turns into a list of updates. Financial performance is separated from the operating decisions that produced it. Risks appear near the end, while the decisions requiring board input are introduced only after most of the meeting time has been used.
The issue is not simply slide count. It is slide logic.
When the purpose of a slide is clear, its design becomes easier to solve. The hierarchy, chart, metric, and supporting detail can all be organized around that one question.
This is the pattern we repeatedly see across the board decks our team has designed. Brand systems change. Company stages change. The underlying structure stays remarkably consistent.
This guide decodes that structure across 15 essential board deck slides. It explains what each slide must accomplish, where attention should land, which visuals support the message, and which common gaps weaken the discussion.
If your team is preparing a high-stakes board presentation, explore how M’idea Hub approaches presentation design for leadership teams.
The Real Purpose of a Board Deck
A board deck should give directors a clear view of company performance, explain what changed and why, and focus the meeting on the areas where their perspective is most valuable.
It has four core jobs:
- Establish whether the company is on track against its agreed priorities
- Connect financial outcomes to the operating decisions behind them
- Surface risks early, with enough context to assess their potential impact
- Frame the decisions, guidance, or introductions management needs from the board
This means the deck must work twice. As a pre-read, it should give directors enough context to arrive informed. During the meeting, it should guide the conversation without forcing management to present every line of every slide.
The Anatomy of 14 Key Board Presentation Slides
1. Cover Slide
- Purpose: The cover slide has a simple job: identify the meeting, reporting period, and version of the deck before the discussion begins.
- Layout and visual anchor: Company name, “Board Meeting,” reporting period, and meeting date arranged in a clear hierarchy.
- Common pattern: Strong board decks use simple, consistent covers that make the meeting and version immediately clear.

2. Agenda Slide
- Purpose: Give directors a clear view of the meeting structure and the relative importance of each section.
- Layout and visual anchor: A numbered sequence of four to six major sections, with decision-heavy topics visually emphasized.
- Common pattern: Strong board decks group related topics into a logical narrative, moving from company performance to operating drivers, risks, and board decisions.

3. Executive Summary
Purpose: The executive summary should tell directors what they need to understand before reviewing the supporting detail.
Layout and visual anchor: Three to five company-level messages supported by selected metrics, implications, or status indicators.
Common pattern: Strong summaries connect results, causes, risks, and immediate priorities.

4. Company Scorecard / KPI Dashboard
- Purpose: Show whether the company is on track against its operating and strategic priorities.
- Layout and visual anchor: A focused set of KPIs showing actual performance, target, previous-period results, and status.
- Use KPI scorecard, variance indicators, or compact trend charts.
The board should be able to identify areas of strength and concern without interpreting the dashboard from scratch.

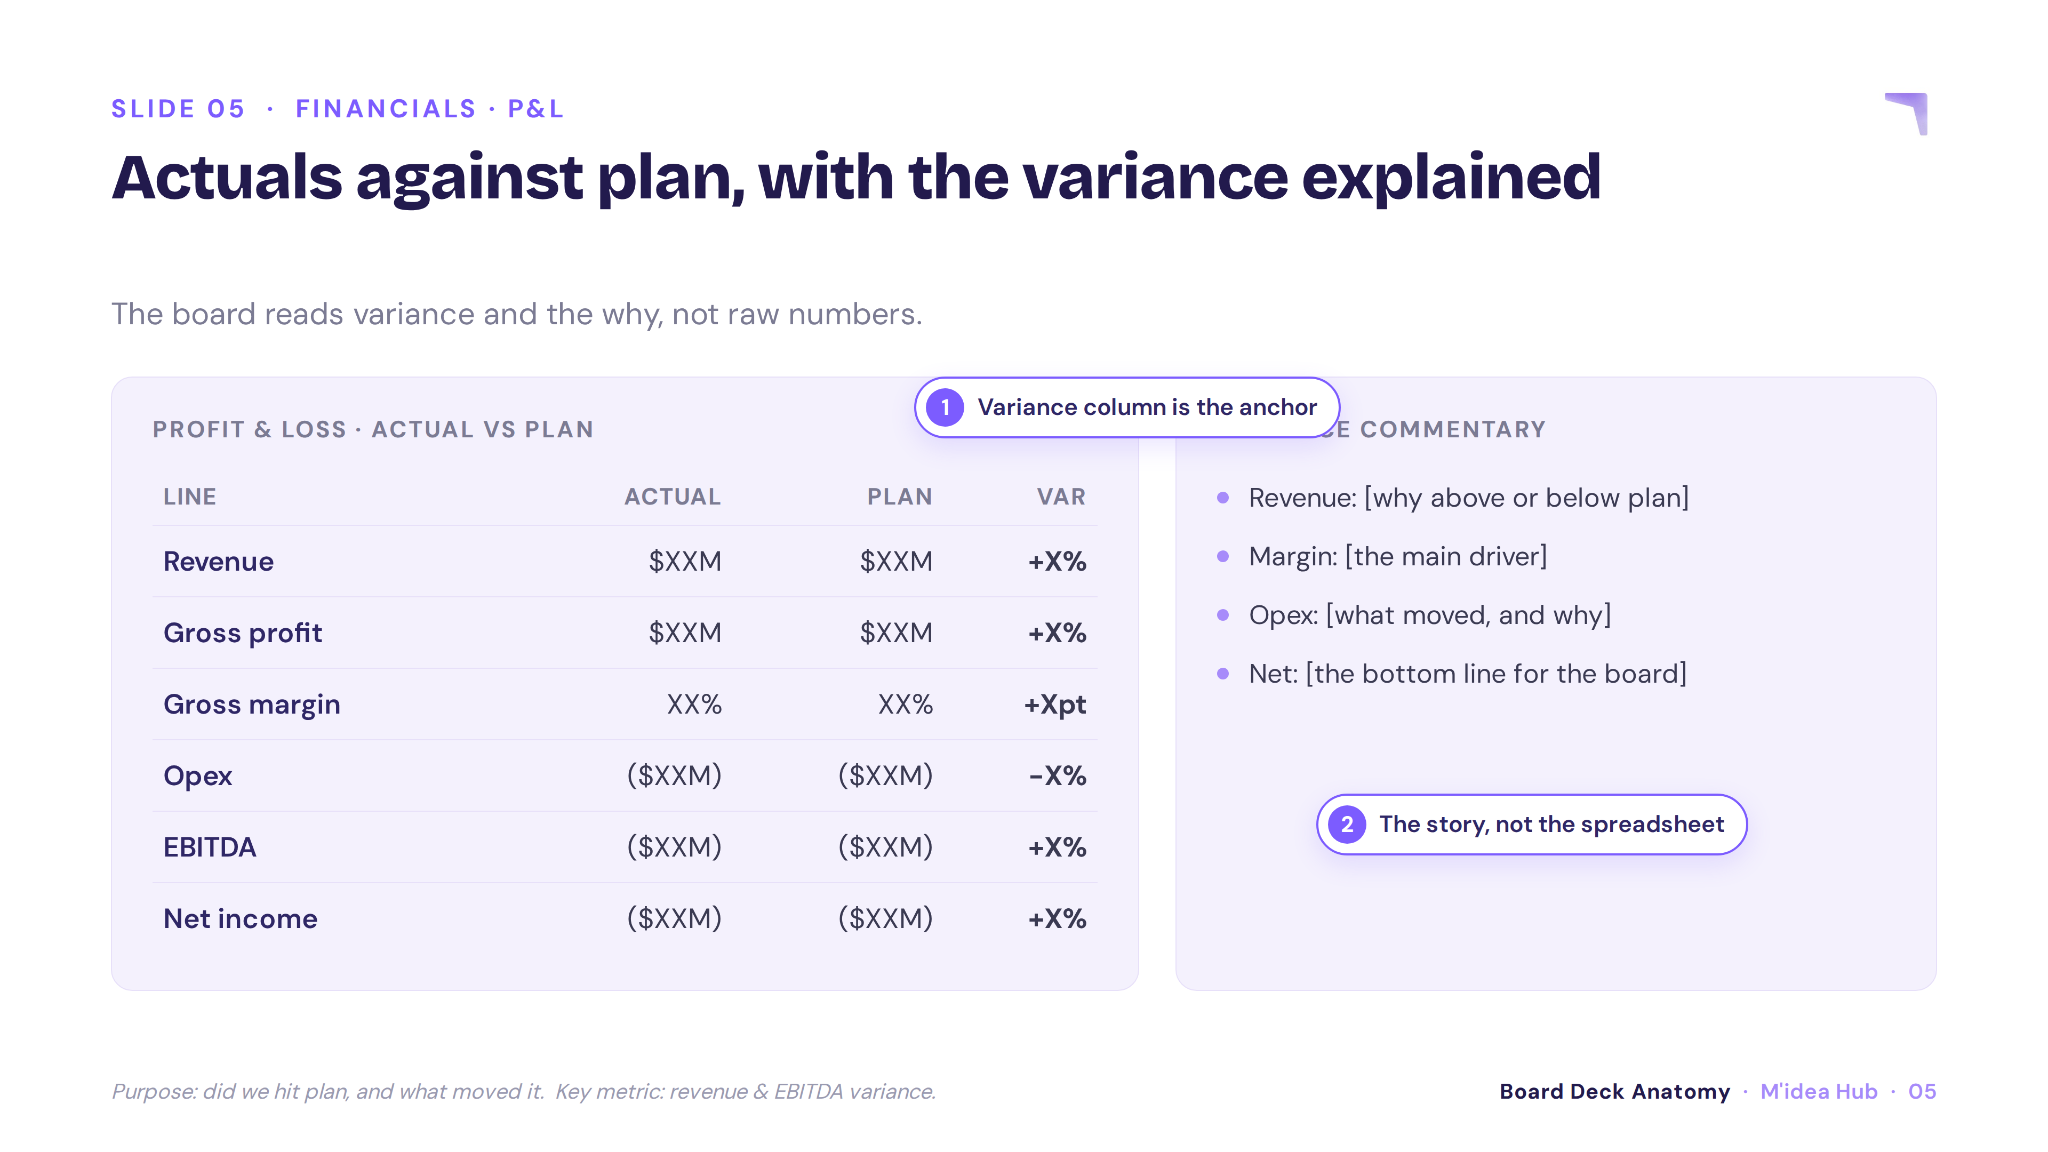
5. Financial Performance (P&L)
Purpose: Explain how the company performed against budget, forecast, and the previous reporting period.
Layout and visual anchor: Revenue, gross margin, operating expenses, and profitability presented with clear variances.
- Use actual-versus-budget table, variance chart, or waterfall showing major drivers.
Detailed financial statements can sit in the appendix. The core slide should focus attention on the movements that materially affect the company’s outlook.
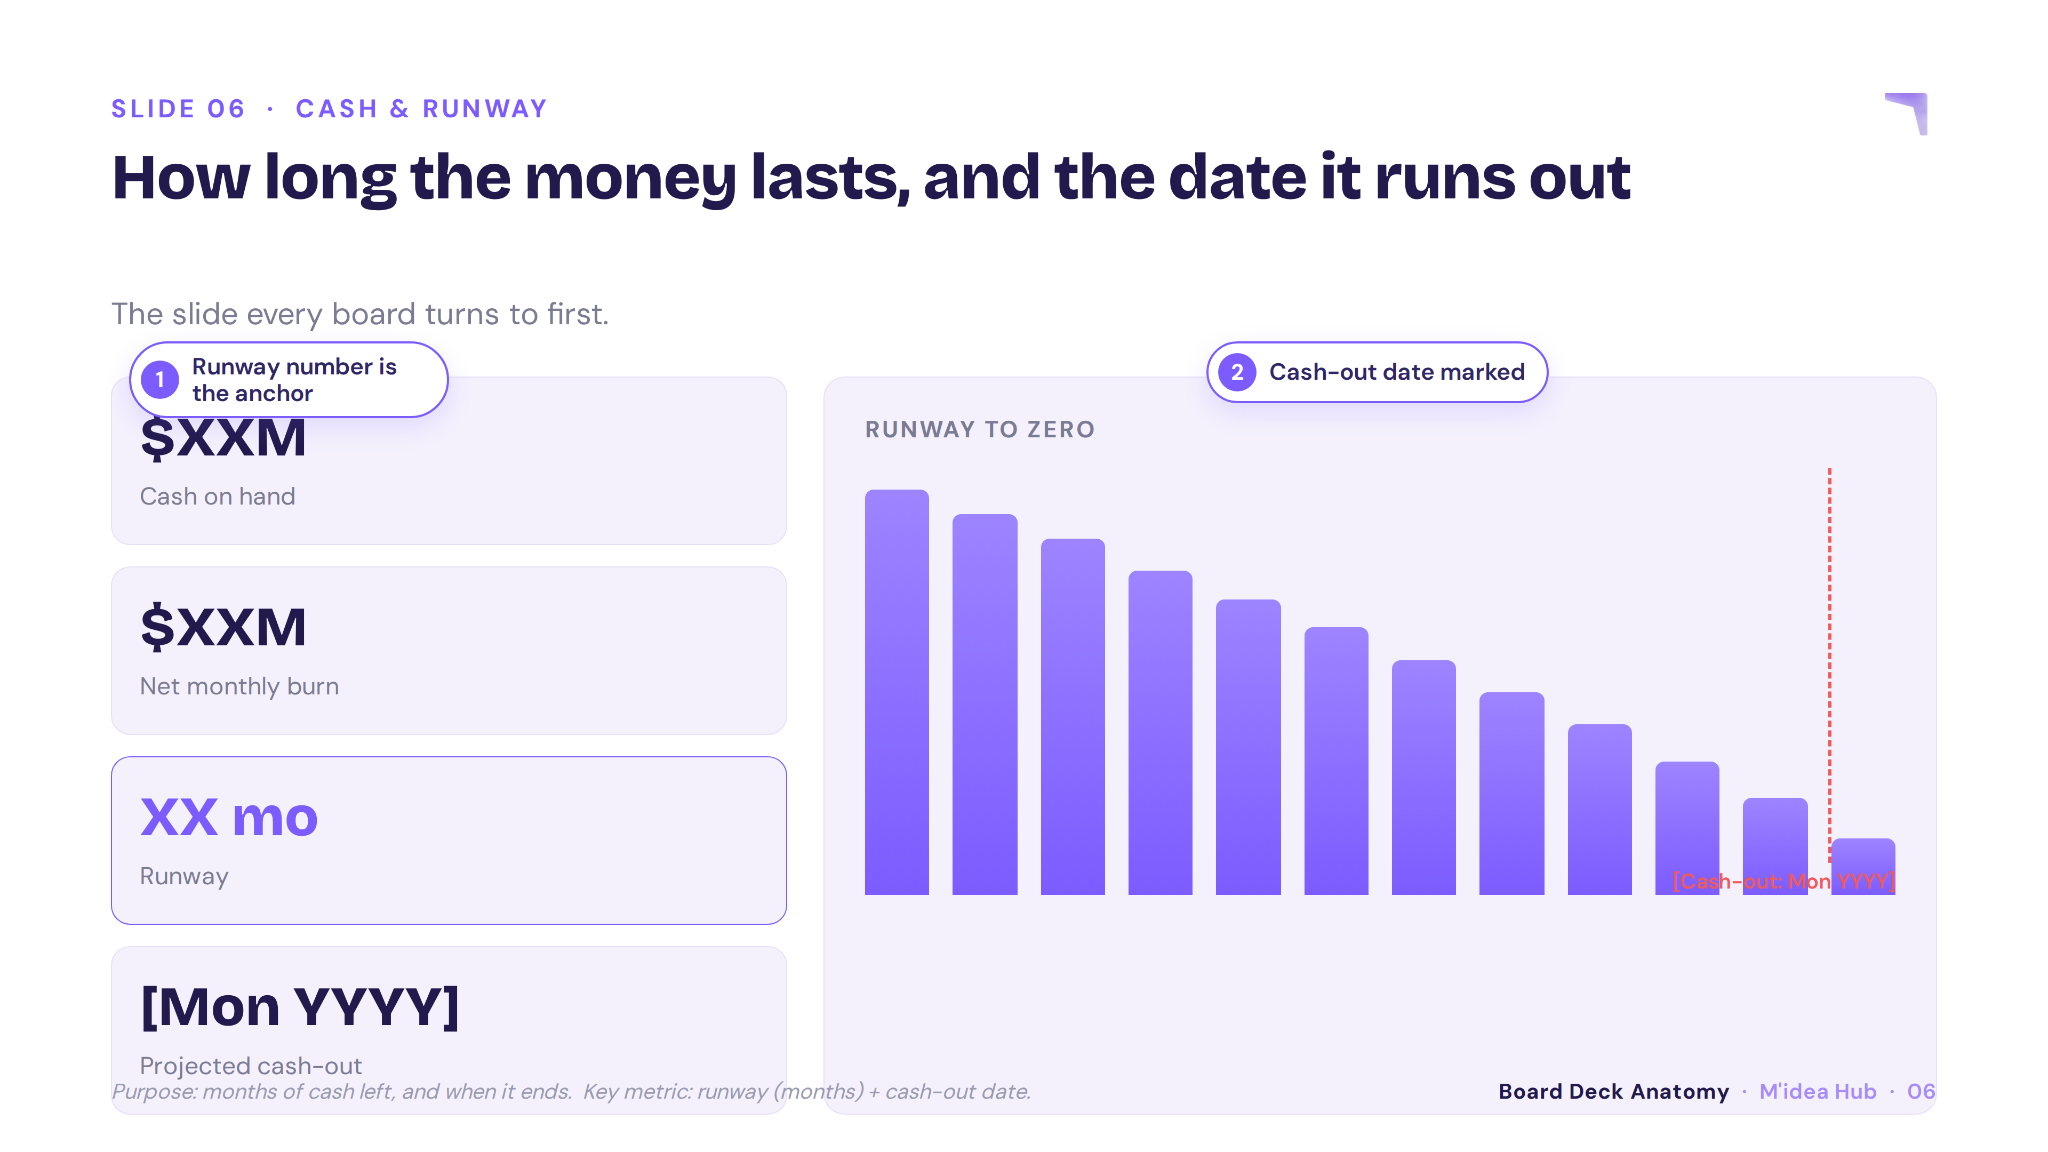
6. Cash and Runway
A runway slide should answer two questions immediately: how much cash remains, and when does the company need to act?
Purpose: Give the board a realistic view of liquidity, burn, and financing timing.
Layout and visual anchor: Current cash balance and estimated runway displayed prominently, followed by the assumptions behind them.
7. Revenue and Growth
Top-line growth alone does not tell the board whether the company is building a durable commercial engine.
Purpose: Show whether revenue is growing as expected and explain what is driving the change.
Layout and visual anchor: Actual growth compared with plan, followed by the segments, products, or customer groups responsible for the result.
- Highlight key metrics - revenue trend, growth bridge, or segment-level comparison.

8. Sales and Pipeline
A large pipeline is only meaningful when directors can see its quality, timing, and likelihood of conversion.
Purpose: Show how reliably the commercial engine is turning opportunities into revenue.
Layout and visual anchor: Pipeline coverage, stage movement, conversion, sales-cycle length, and forecast impact.
- Showcase sales funnel, pipeline waterfall, stage-conversion view, or coverage comparison.

9. Product and Roadmap
Purpose: The product section should explain what was delivered, what comes next, and why those priorities matter.
Layout and visual anchor: Now-next-later roadmap, milestone timeline, or strategic priority matrix.

10. Retention and Customer Metrics
Purpose: Help the board assess customer health, revenue durability, and emerging churn risk.
Layout and visual anchor: Highlight metrics for retention trend, customer segments, and the principal causes behind meaningful changes.
- Use charts like cohort analysis and retention curve.

The most useful retention slides explain what changed, why it changed, and what management is doing in response.
11. Team and Hiring
Purpose: Show whether the company has the leadership, capacity, and critical capabilities required for its next stage.
Layout and visual anchor: Headcount against plan, critical open roles, leadership gaps, and material organizational changes.
- Use org charts
The emphasis should remain on the organizational decisions that could accelerate or constrain execution.

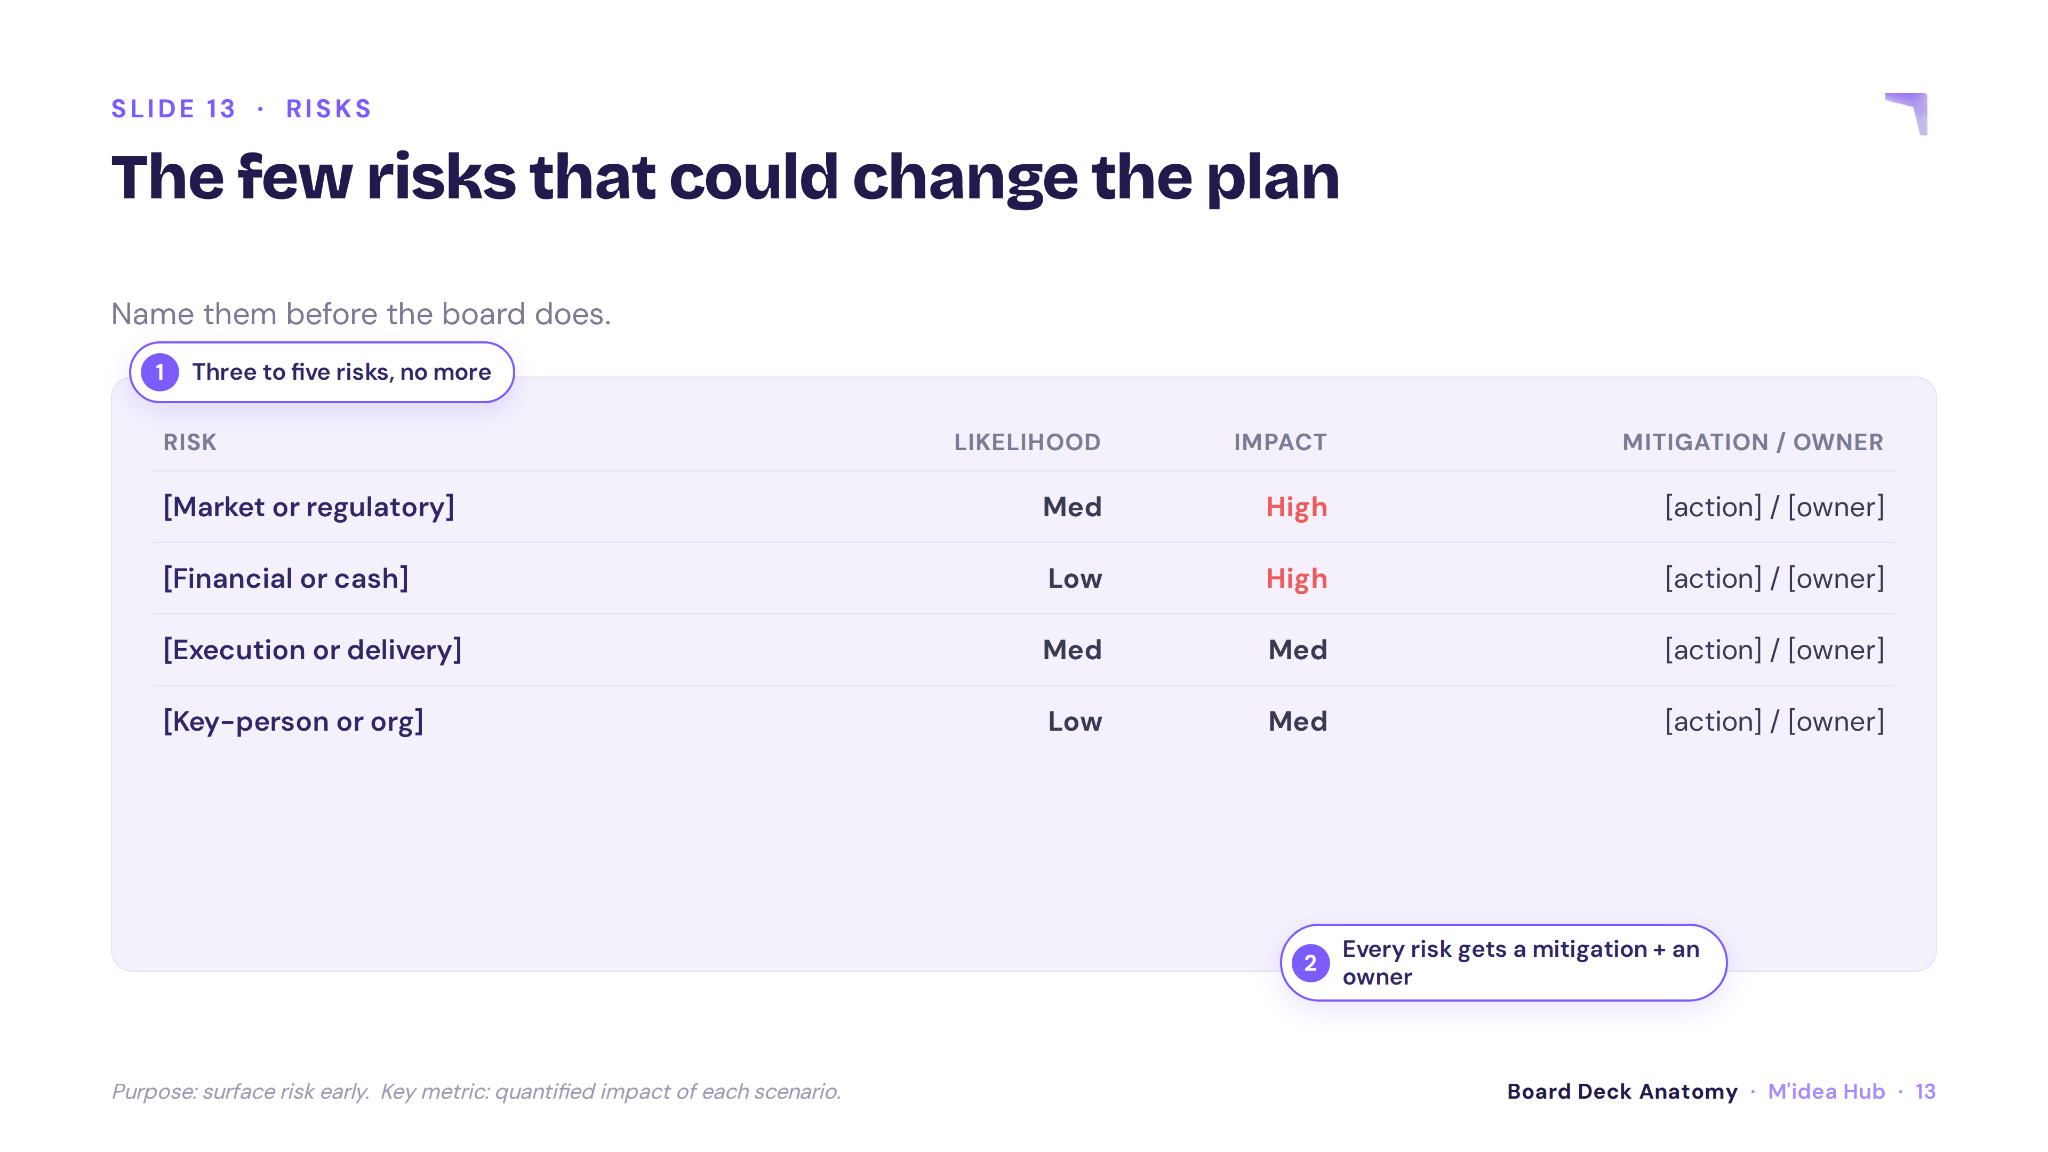
12. Risks
An effective risk slide shows the board where management sees uncertainty and how the company is responding.
Purpose: Identify issues that could materially affect performance, timing, capital requirements, or strategic priorities.
Layout and visual anchor: A focused list of material risks organized by severity, likelihood, ownership, and mitigation.
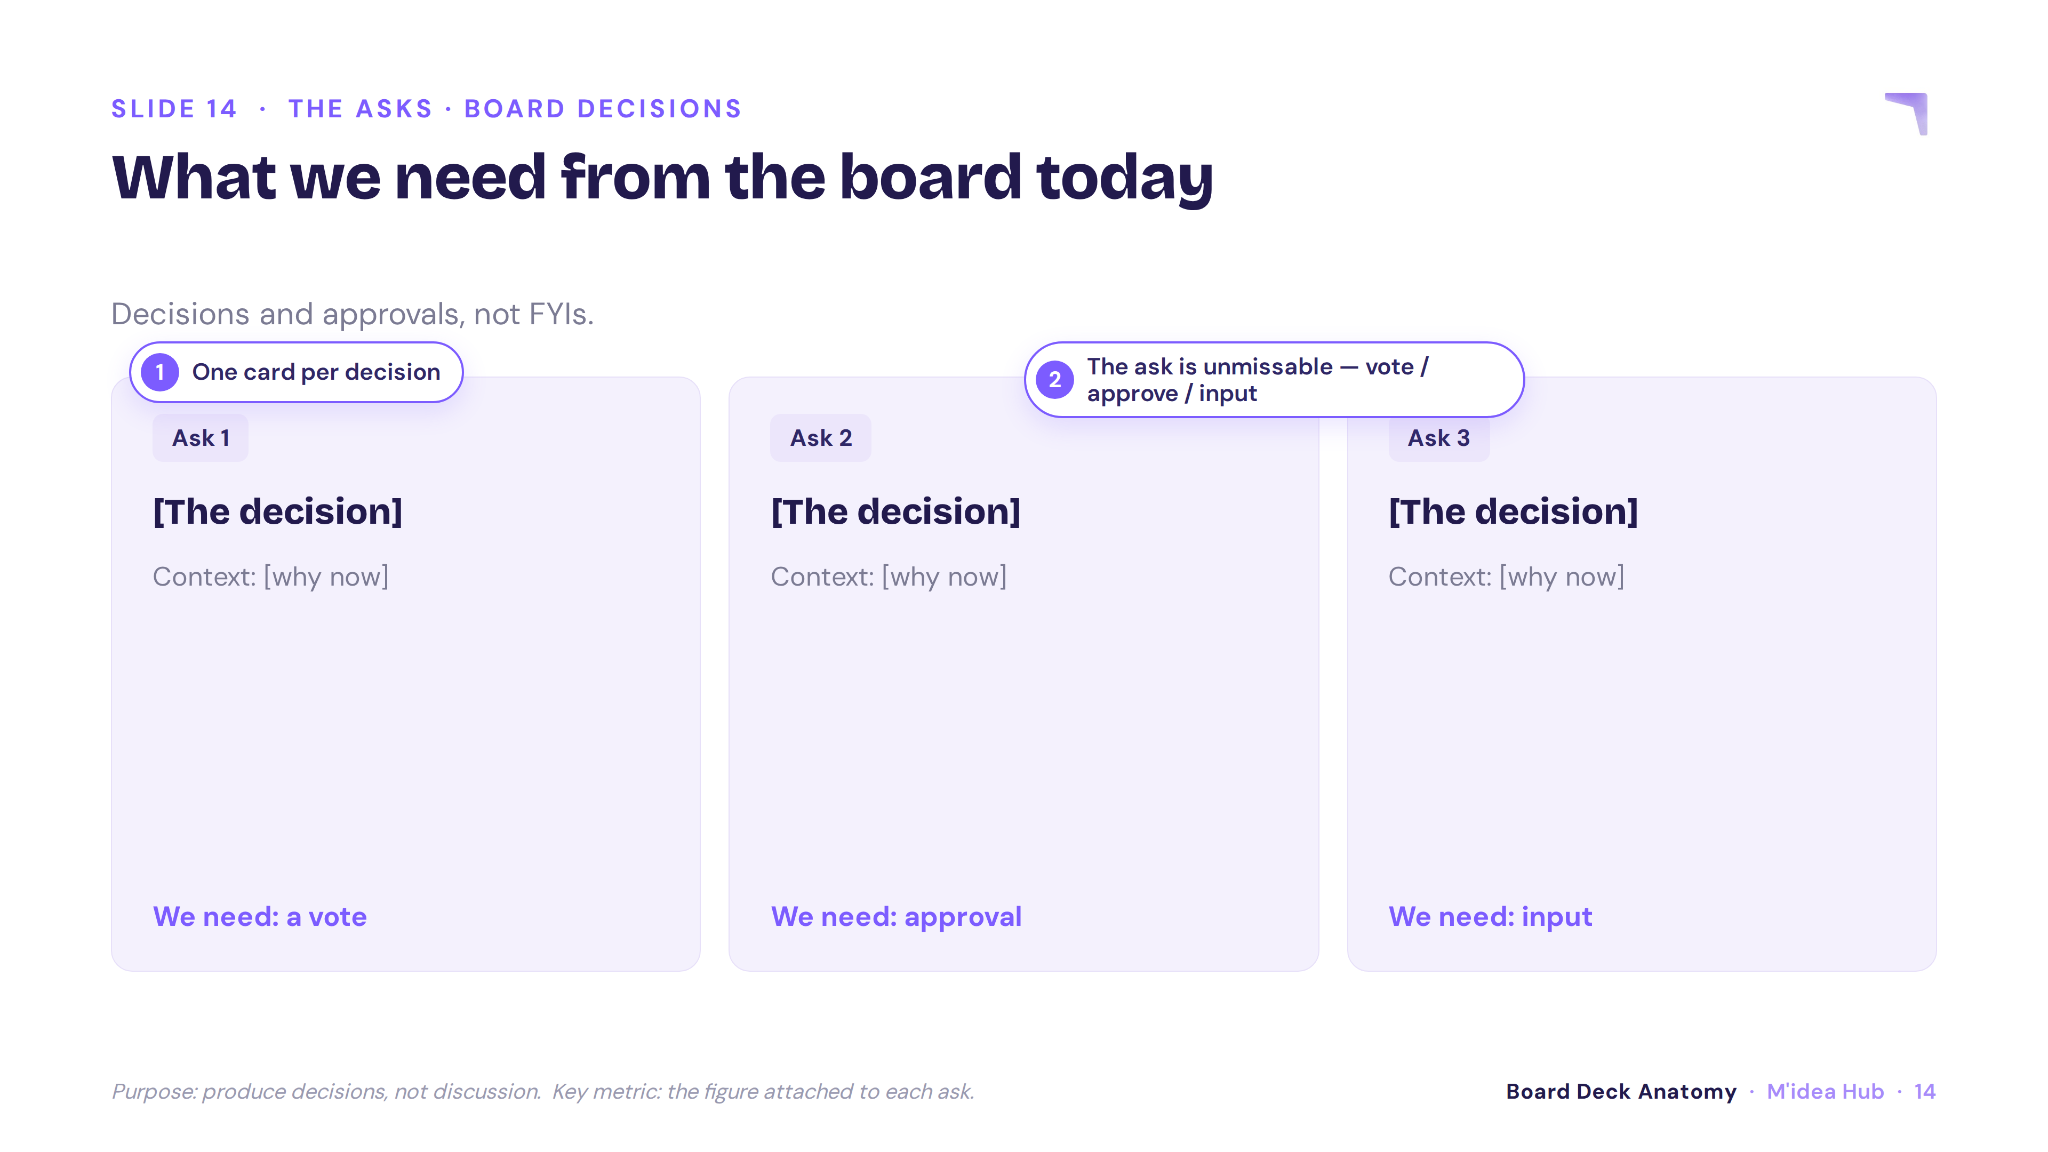
13. Board Asks and Decisions
Purpose: Clearly state the decisions, guidance, introductions, or support required from directors.
Layout and visual anchor: The decision or question placed prominently, followed by relevant context, options, and management’s recommendation.
Common pattern: Strong decks distinguish between items requiring approval, discussion, advice, or individual follow-up.
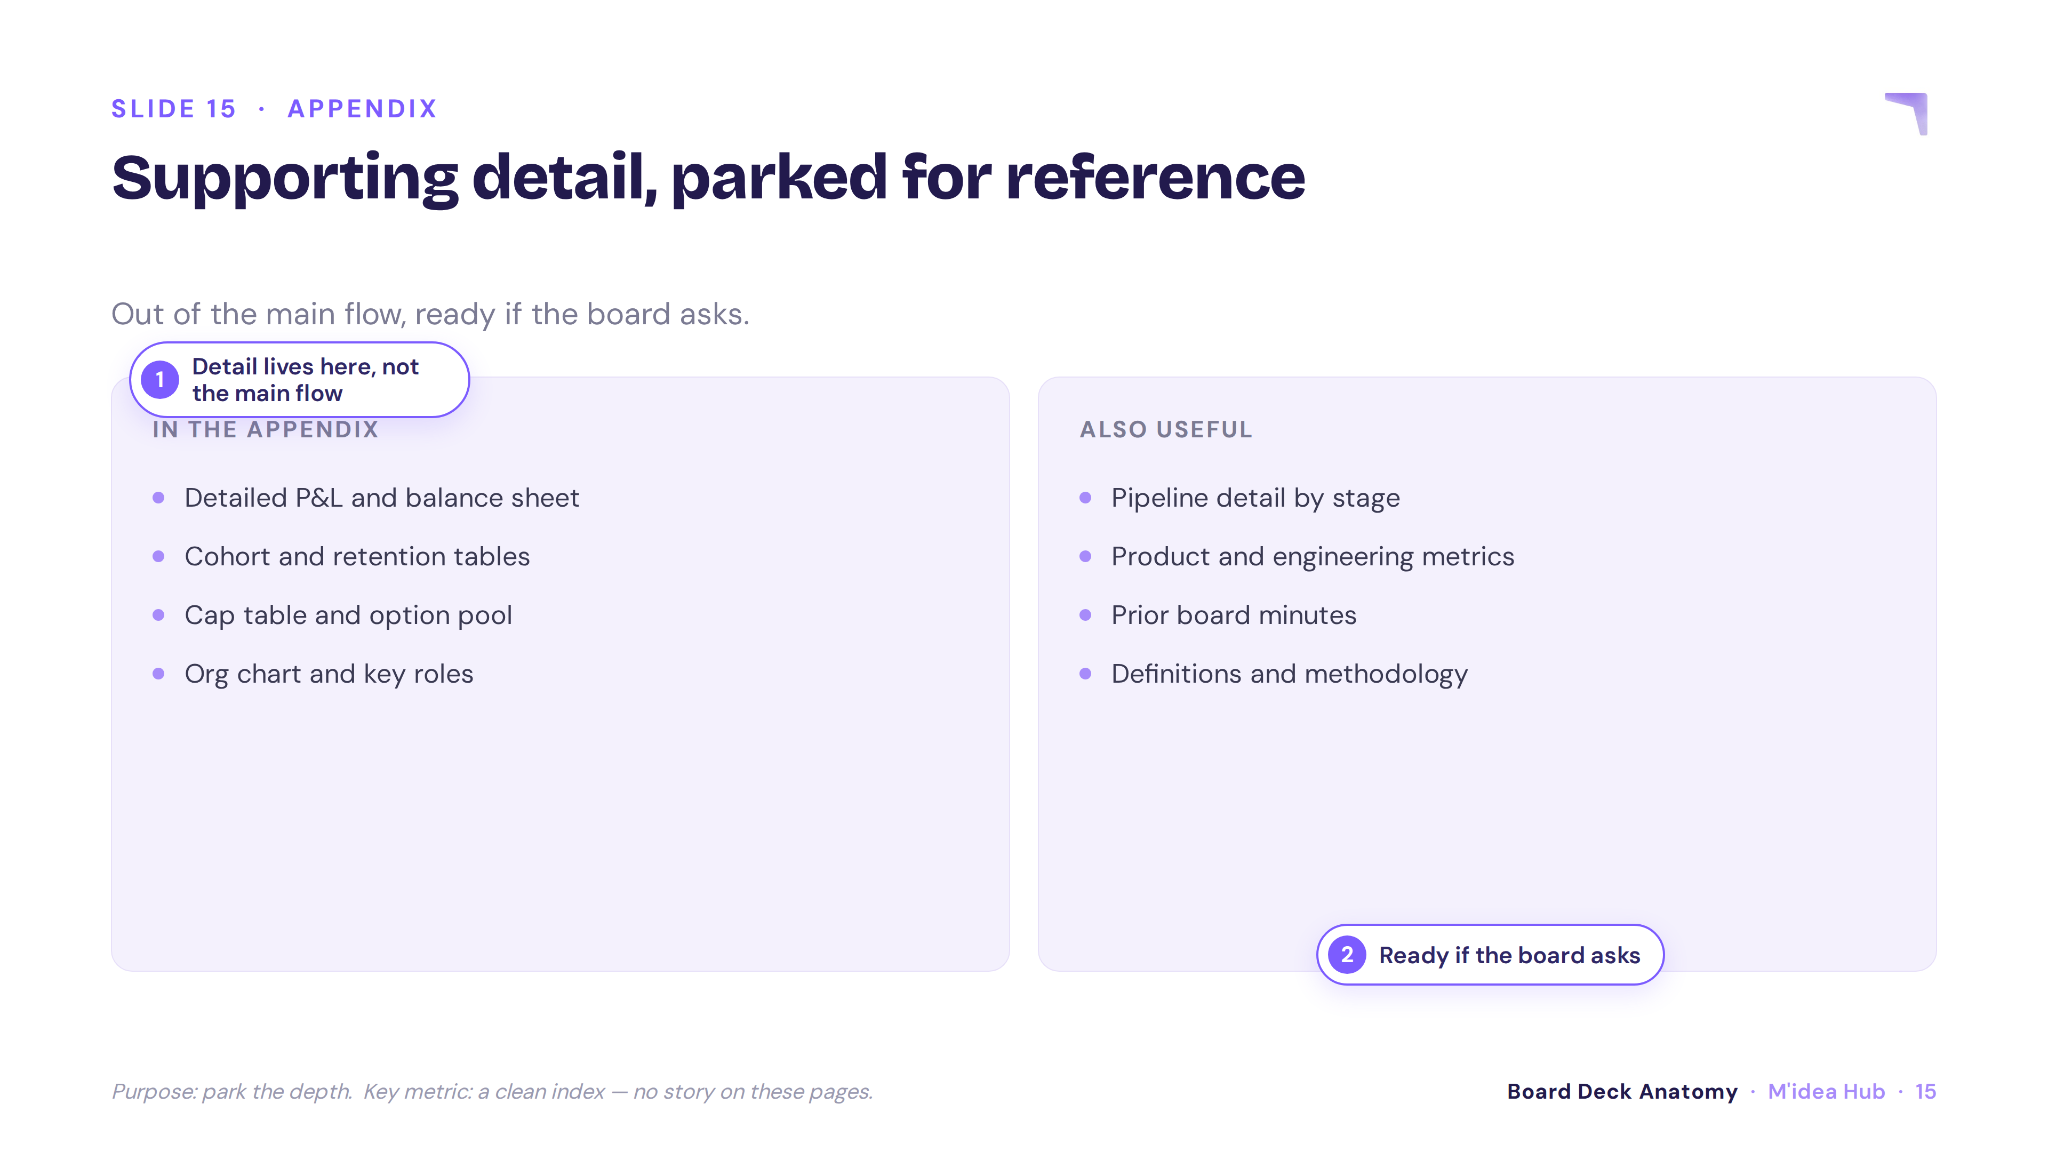
14. Appendix
The appendix allows the core presentation to remain focused while keeping supporting information available.
Purpose: Provide deeper evidence directors may need before or during the discussion.
Layout and visual anchor: Detailed financial statements, customer cohorts, operating data, methodologies, and secondary analysis.
What Strong Board Decks Consistently Get Right?
After reviewing the slides individually, a consistent pattern becomes clear. Strong board decks are not simply well-designed. They are structured to reduce interpretation and keep attention on the company’s most important issues.
Across the board presentations our team has designed, the strongest decks consistently:
- Give every slide one clear purpose
- Use takeaway-led titles that communicate the conclusion, not just the topic
- Show metrics alongside targets, trends, and relevant context
- Maintain consistent definitions and reporting periods across meetings
- Give the most important information the greatest visual emphasis
- Connect financial results to the operational factors behind them
- Present cross-functional updates as one cohesive company narrative
- Move supporting detail into a clearly organized appendix
- Make risks, decisions, and board asks easy to identify
Key Takeaway!
A strong board deck is not defined by elaborate visuals. It is defined by how quickly directors can understand the company’s position, recognize what has changed, and identify where their attention is required.
That starts with visual hierarchy. Each slide should lead with one clear conclusion, give the most important metric the greatest emphasis, and use charts to reveal the meaning behind the data, not simply display it.
Consistency across typography, color, spacing, chart styles, metric formats, and section layouts is equally important. When updates come from finance, sales, product, and leadership, the design system should bring them together as one company-level narrative.
The best board presentation design reduces interpretation. It makes performance easy to assess, risks difficult to overlook, and decisions easy to locate. When slide logic, hierarchy, and data visualization work together, the deck becomes more useful both as a pre-read and as a guide for the live discussion.
Preparing for an Upcoming Board Meeting?
Your team has the information. We bring it together through clear hierarchy, purposeful data visualization, and one cohesive design system, so directors can quickly understand what changed, what matters, and where their input is needed.
.webp)