Designing a 70+ Slides Corporate Presentation for Veru, a NASDAQ-Listed Biopharma Company


Veru Inc., NASDAQ-listed clinical-stage biopharma develops oral drugs for obesity and pancreatic cancer. Their investor relations team needed a corporate presentation that could work across investor emails, conferences, and roadshows. Its working deck contained the science and clinical evidence, but needed clearer structure, stronger visual hierarchy, and a consistent design.
M’idea Hub restructured and redesigned the presentation, bringing both programs into one connected investor story while preserving the underlying scientific content.
Biopharmaceutical
6 weeks
Corporate Presentation
Miami, FL

Veru shared its working corporate deck, version 17 with 65 slides, along with earlier versions and its public conference deck. As new trial results and an oncology program were added, the presentation had grown slide by slide. Long bullet lists, dense tables, and figures copied from publications made it difficult to identify the main point quickly.
The challenge was to help investors follow the story, understand the evidence, and distinguish between the two programs without losing important detail.
Pain-Points
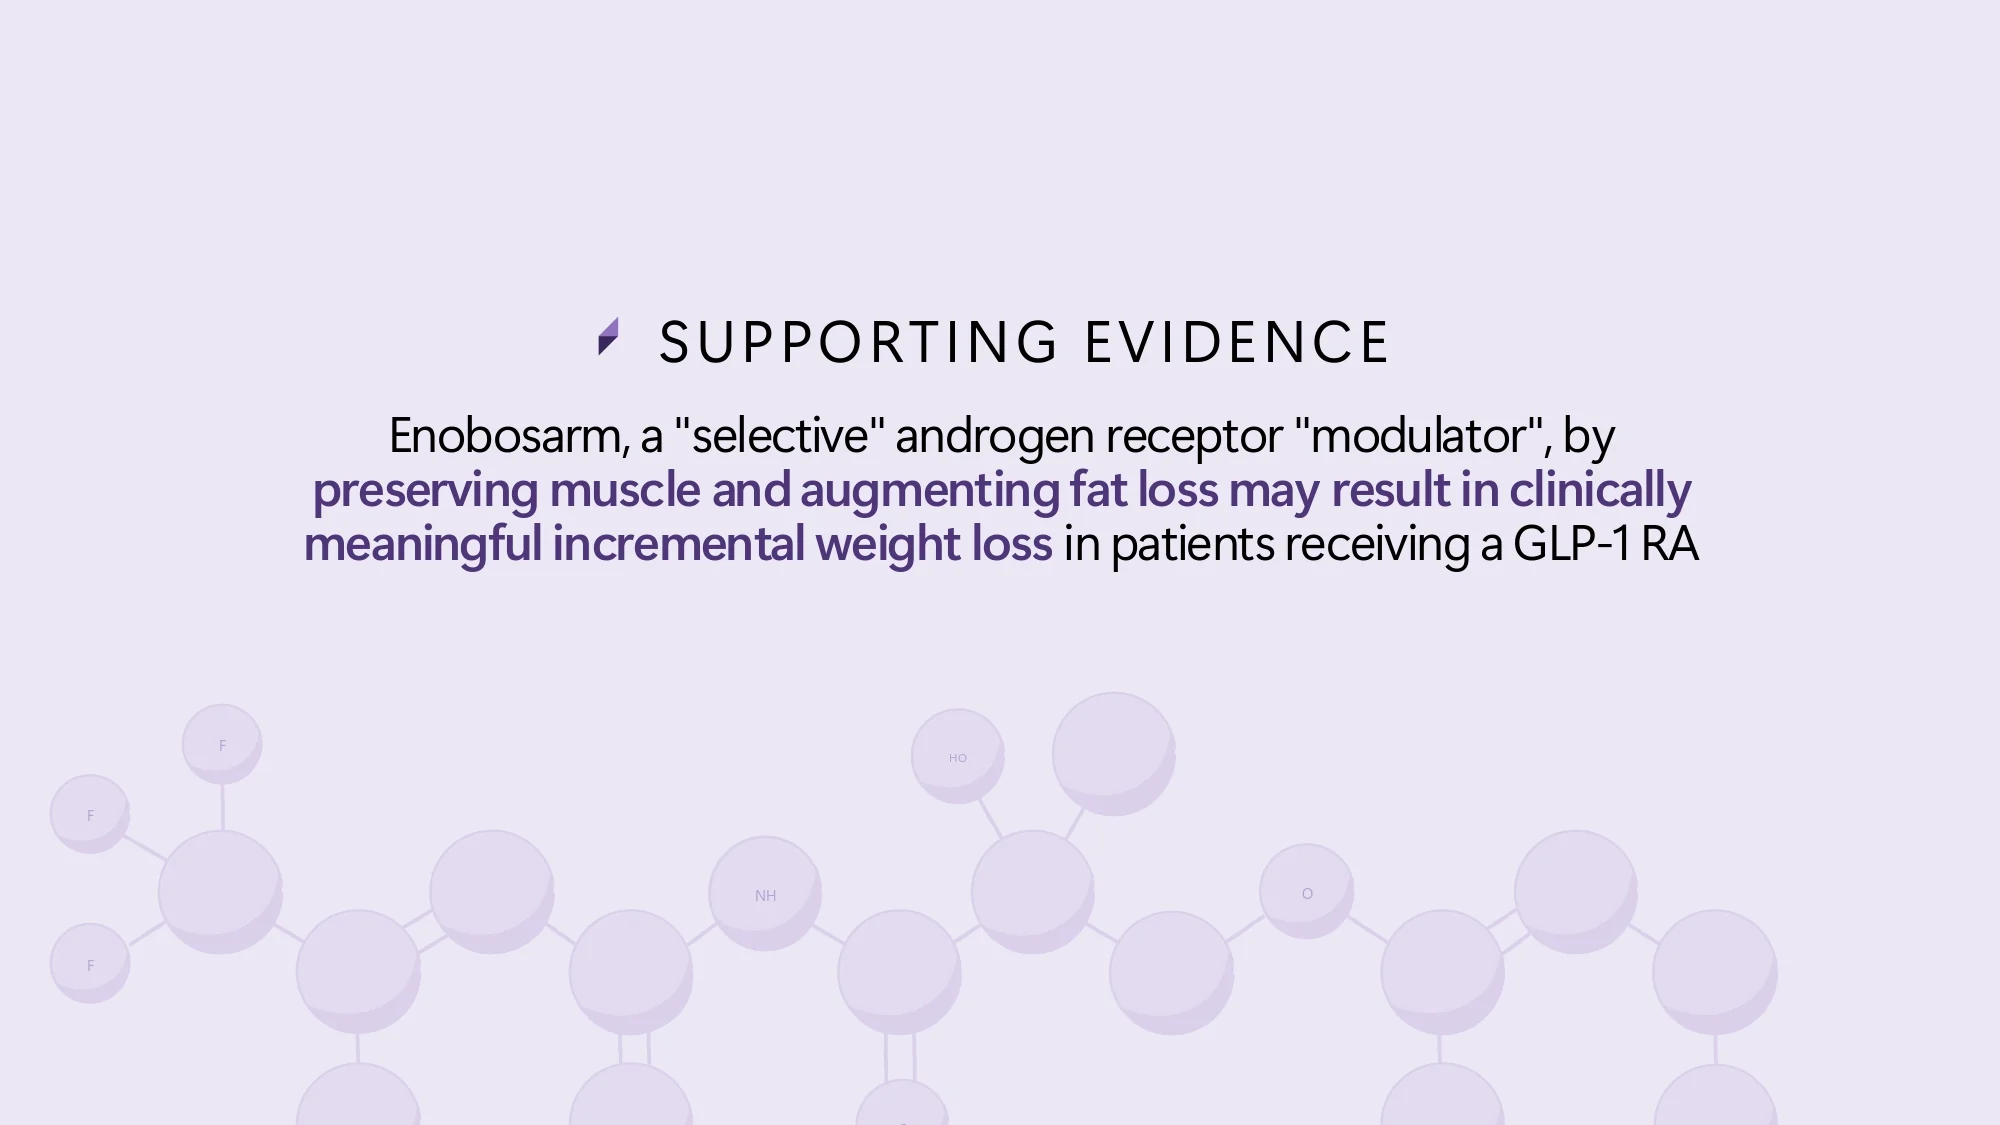
Key messages were buried in paragraphs and nested bullets, so investors had to read instead of scan.
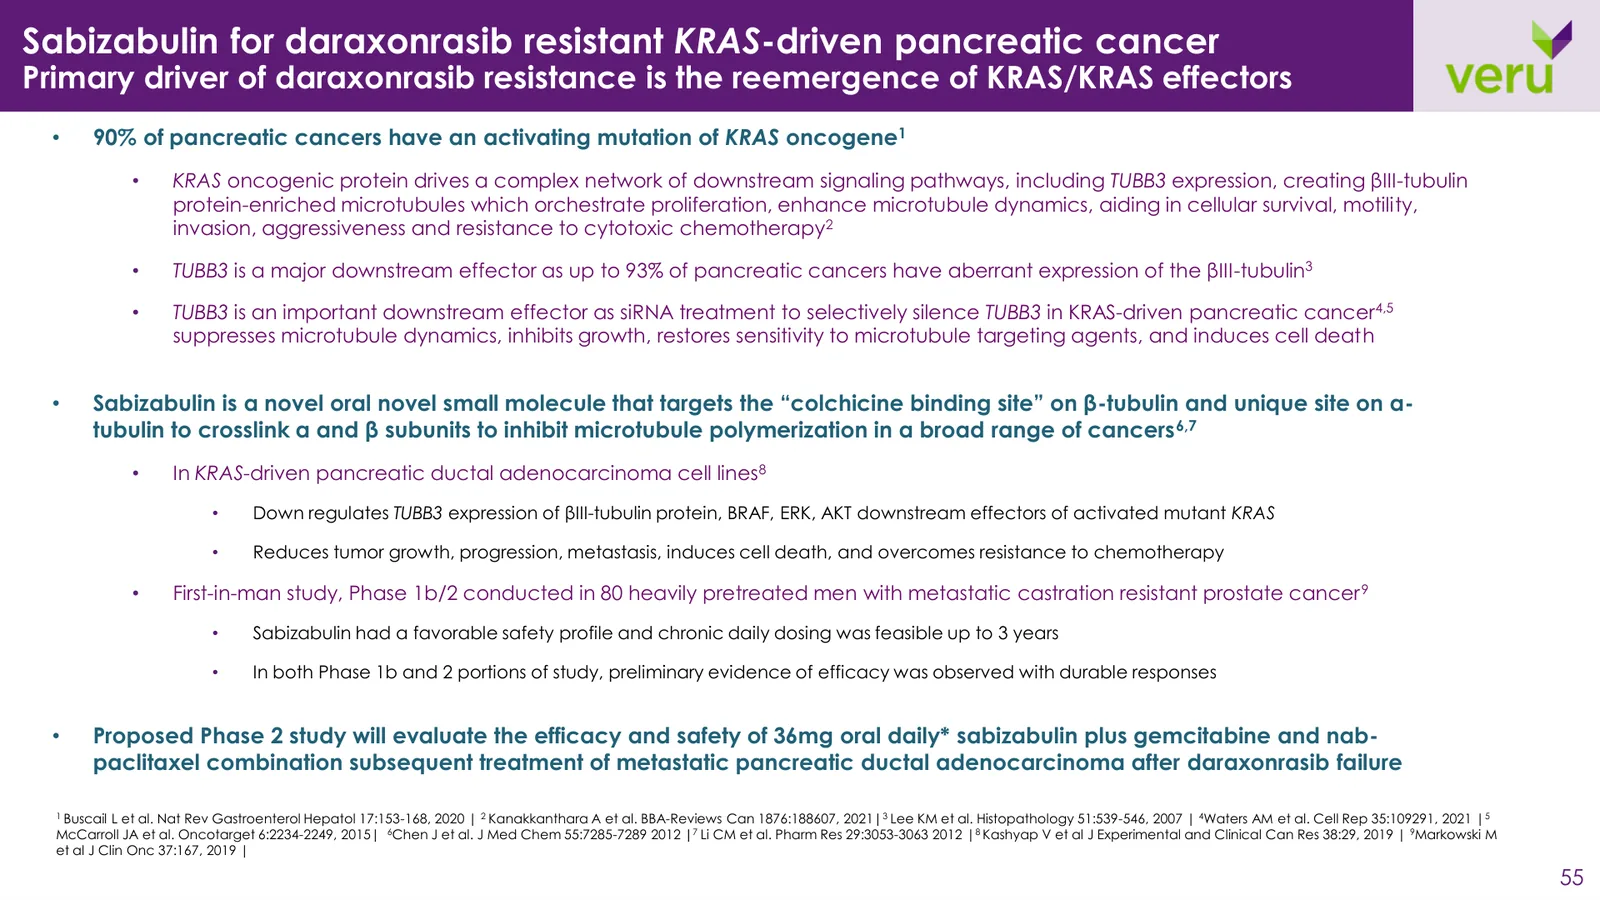

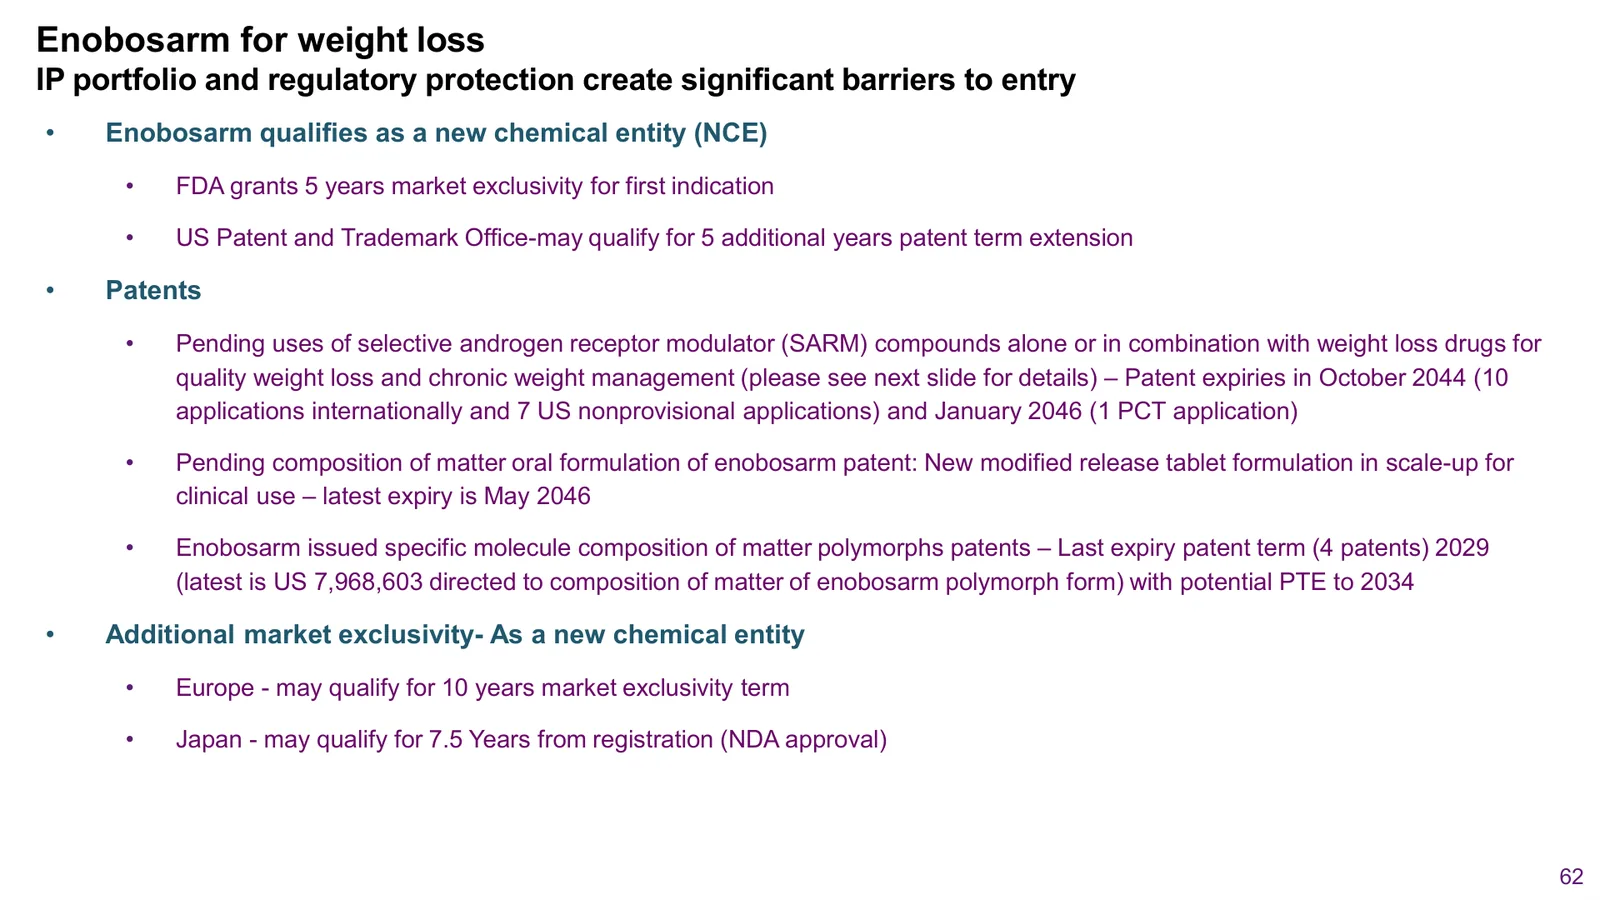
Titles described topics instead of conclusions, and the most important data had no visual emphasis.
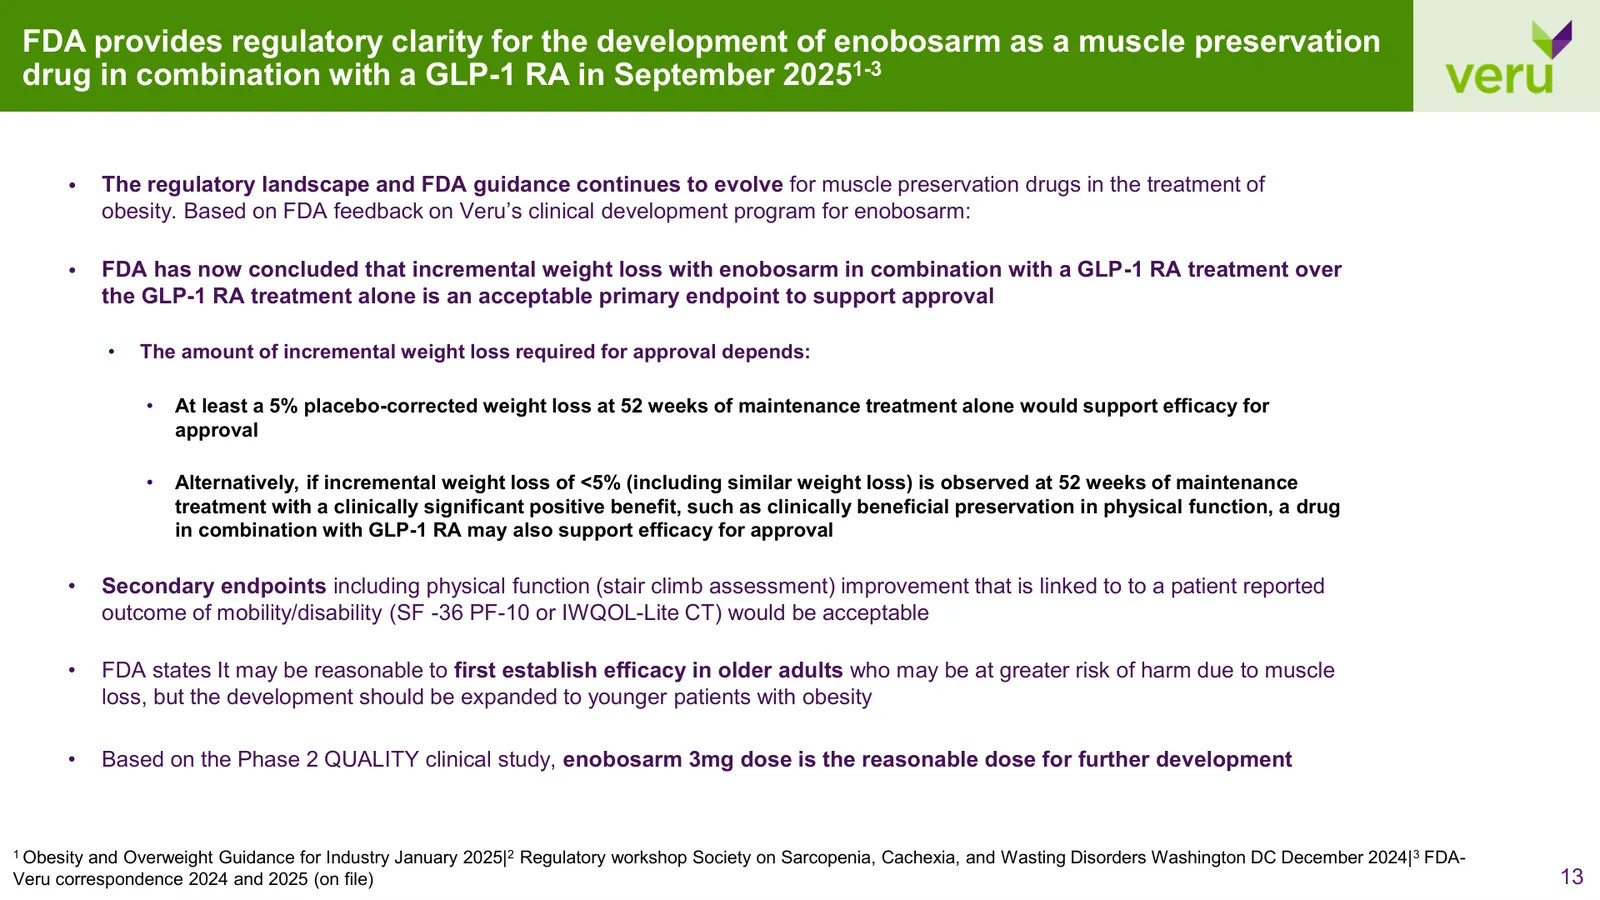
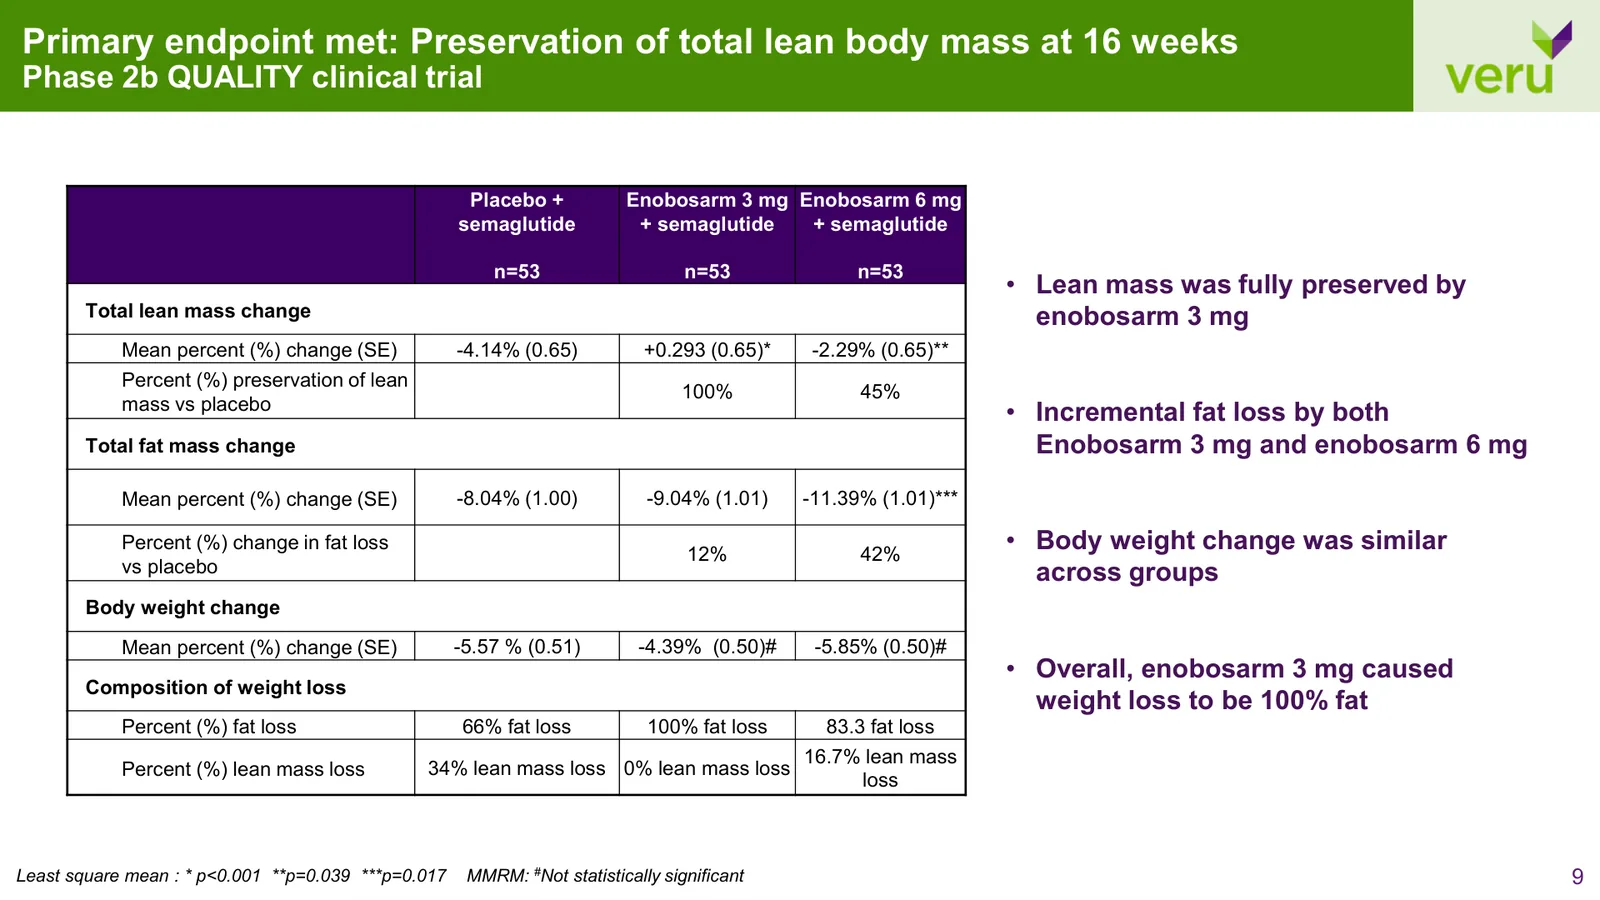
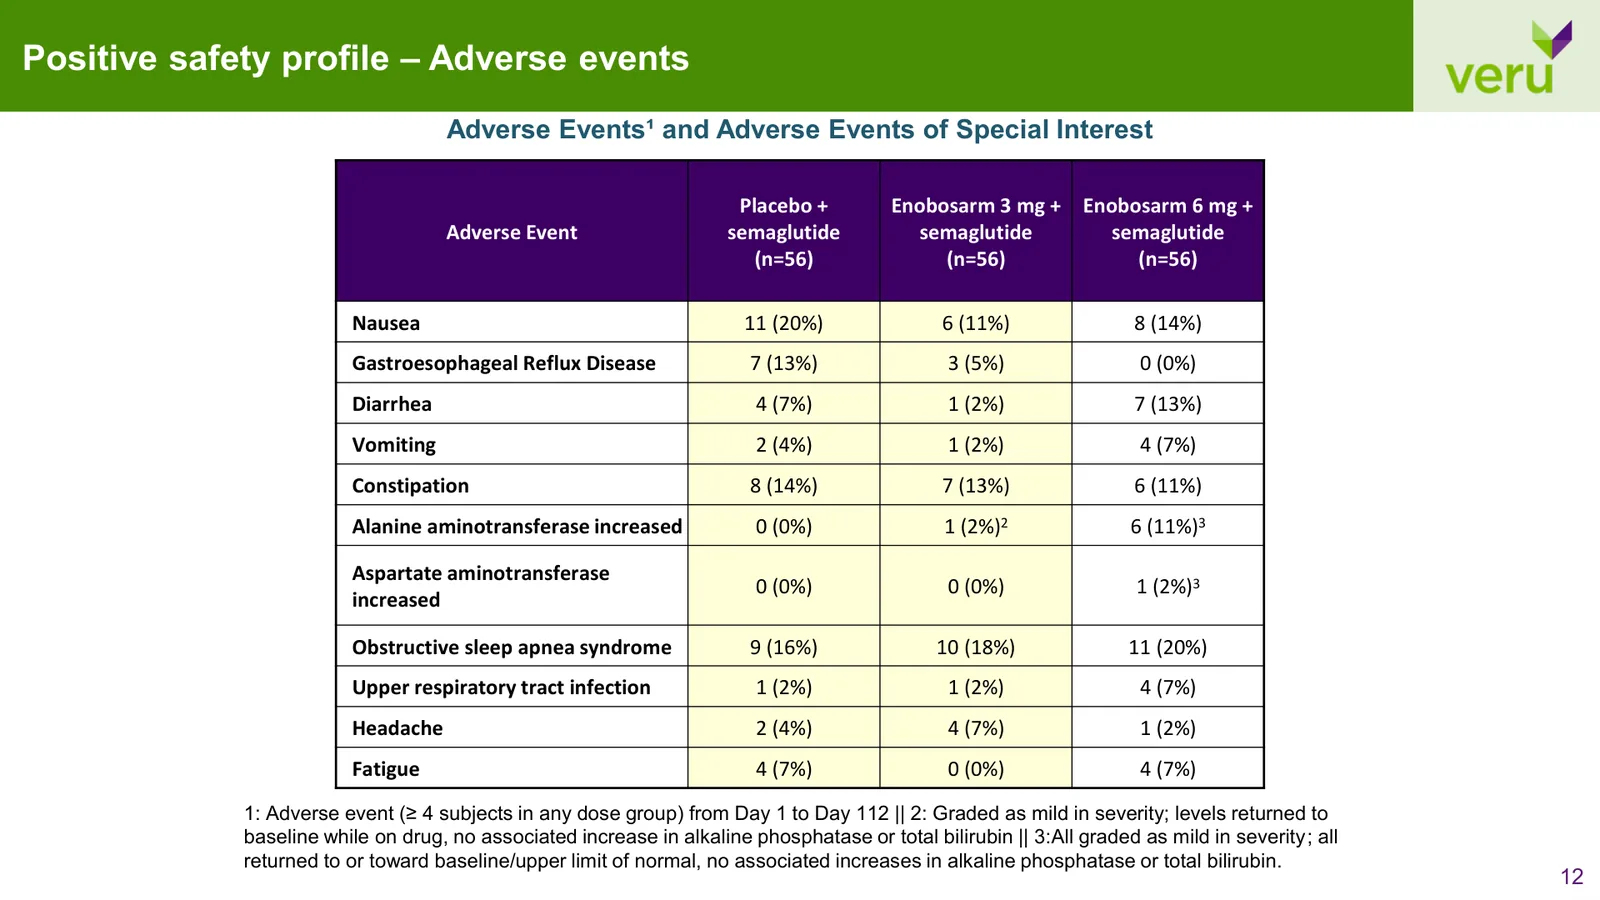
Stock template elements, clashing colors, and generic shapes made every slide carry the same weight.

Pathway and mechanism figures were screenshots from journals, each in a different style and resolution.
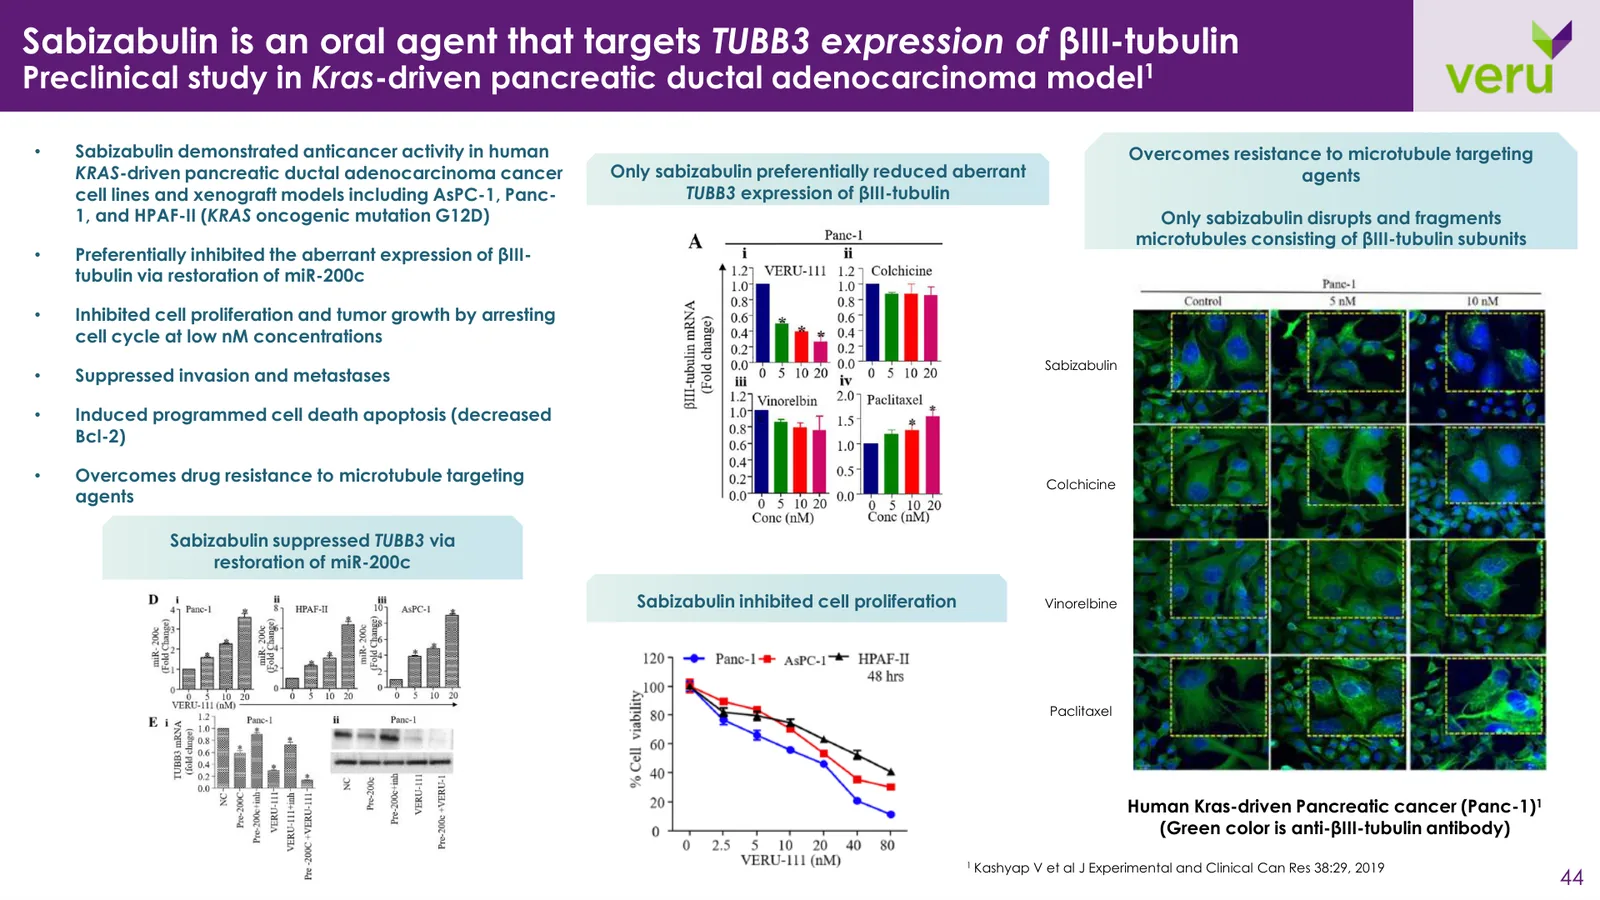
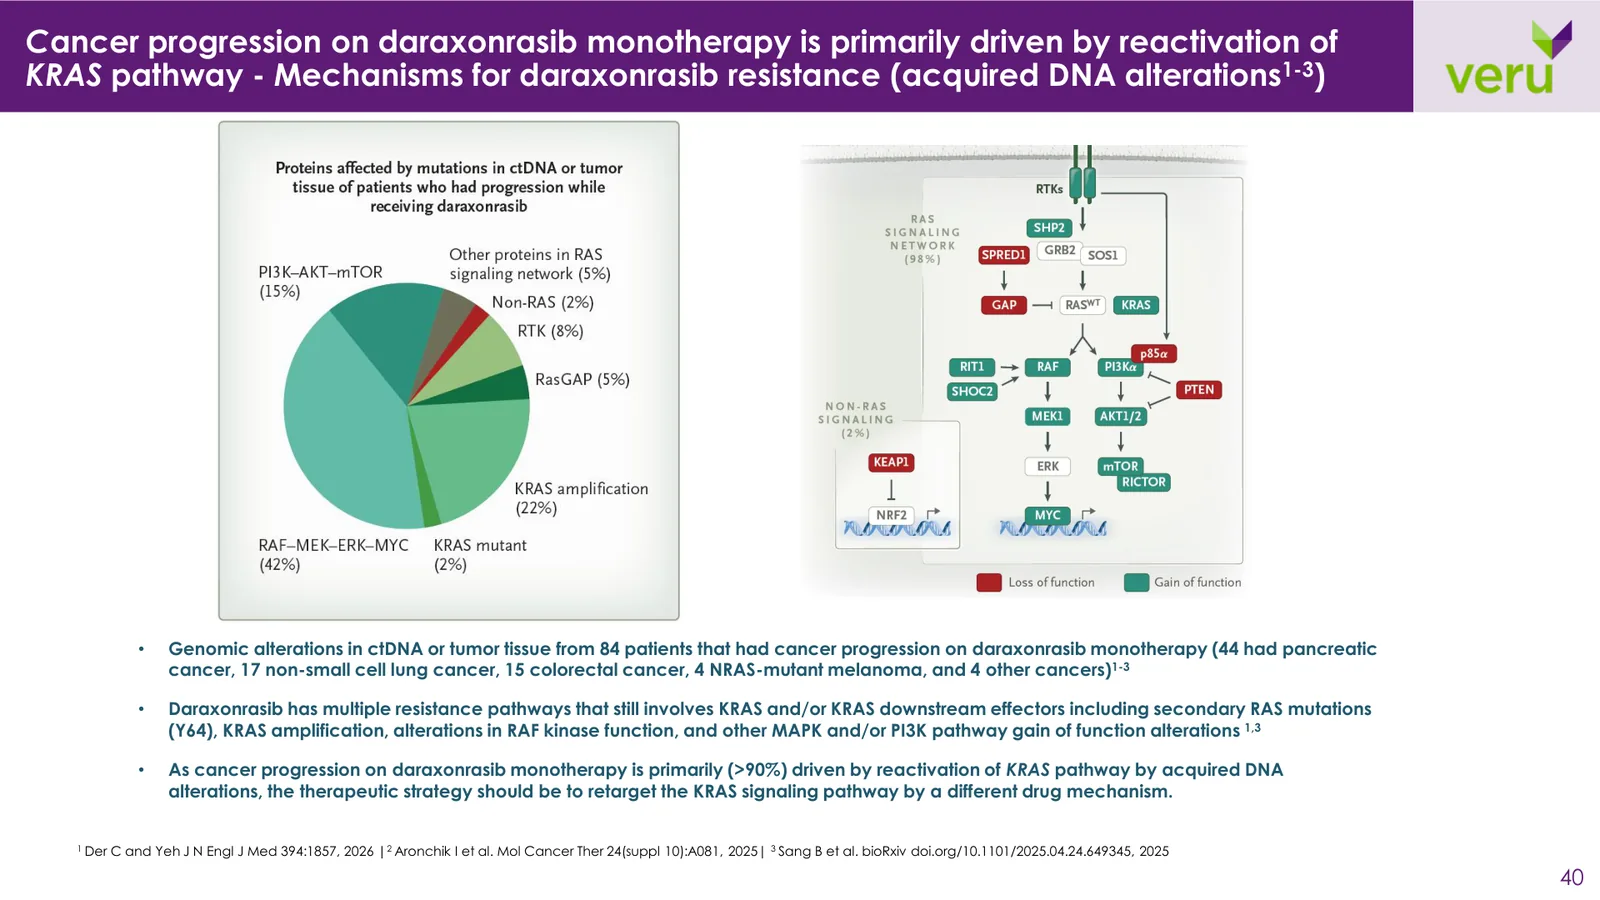
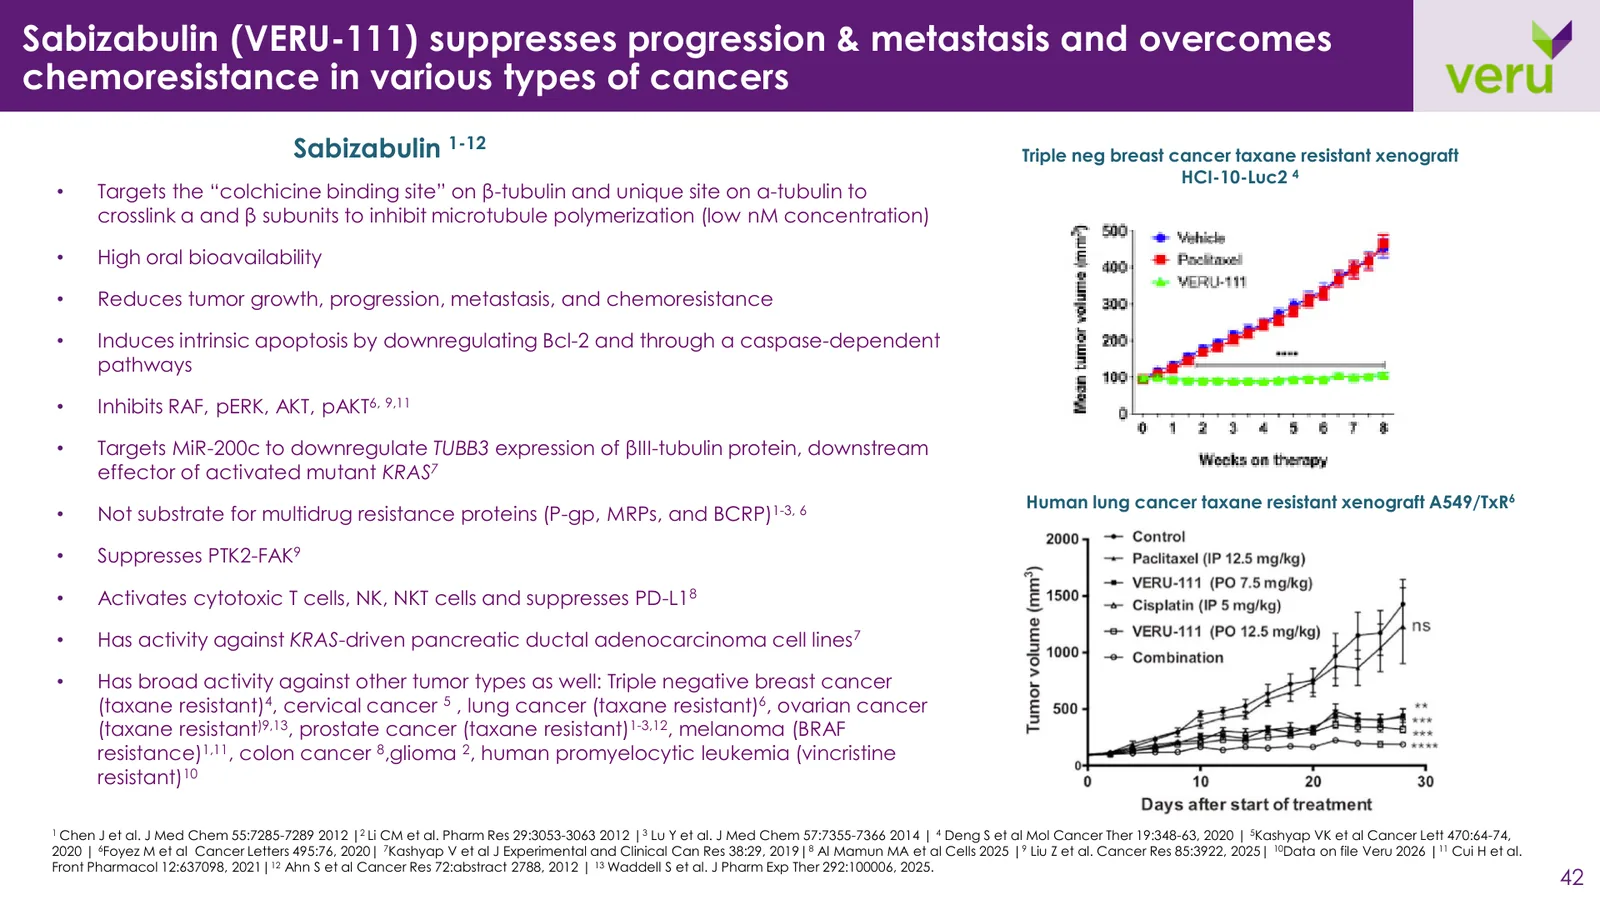
Kick-off calls with Veru's investor relations lead and CEO on audience, goals, and every slide.
A wireframe-only pass: story order, section breakers, and eyebrow navigation.
Two design explorations benchmarked against leading biotech decks. Option 1 approved.
73 slides with custom illustrations and rebuilt charts, every number checked against source.
Conference and roadshow updates, plus a standalone obesity-program deck.
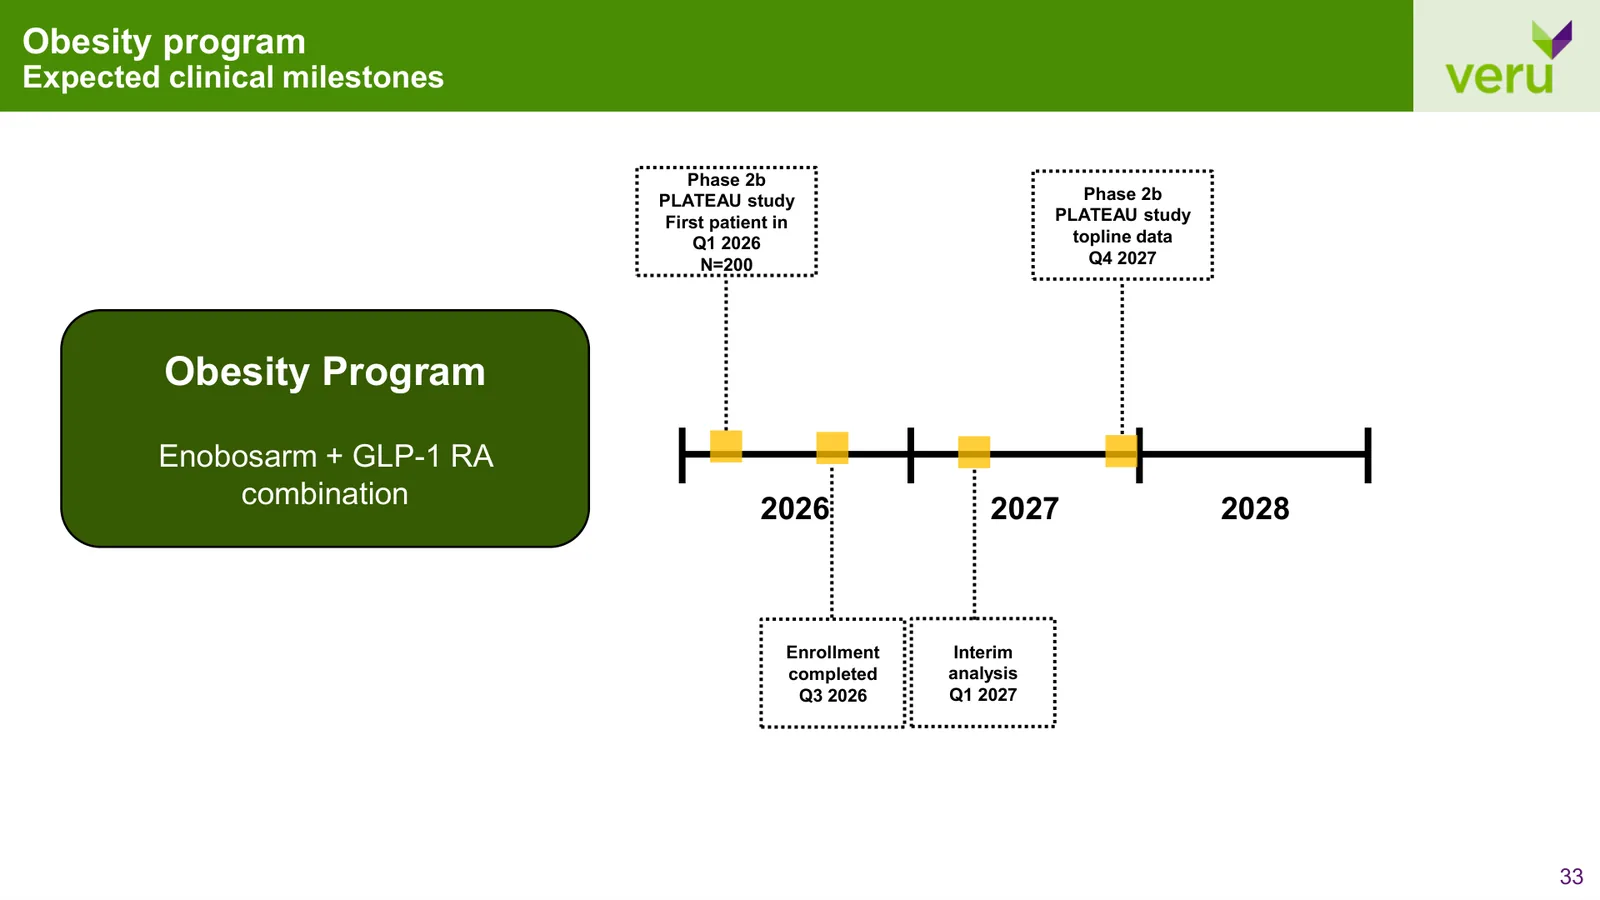
Each program needed its own logical progression while remaining part of the same corporate presentation. We organized the content around the questions an investor would need answered: Who is affected? What is Veru developing? What does the evidence show? What comes next?
Section dividers, small section labels, and program-specific colors helped make that progression visible throughout the deck.
Improvements
Logical Flow
Section Breakers
Eyebrow Navigation
Color-Coded Programs


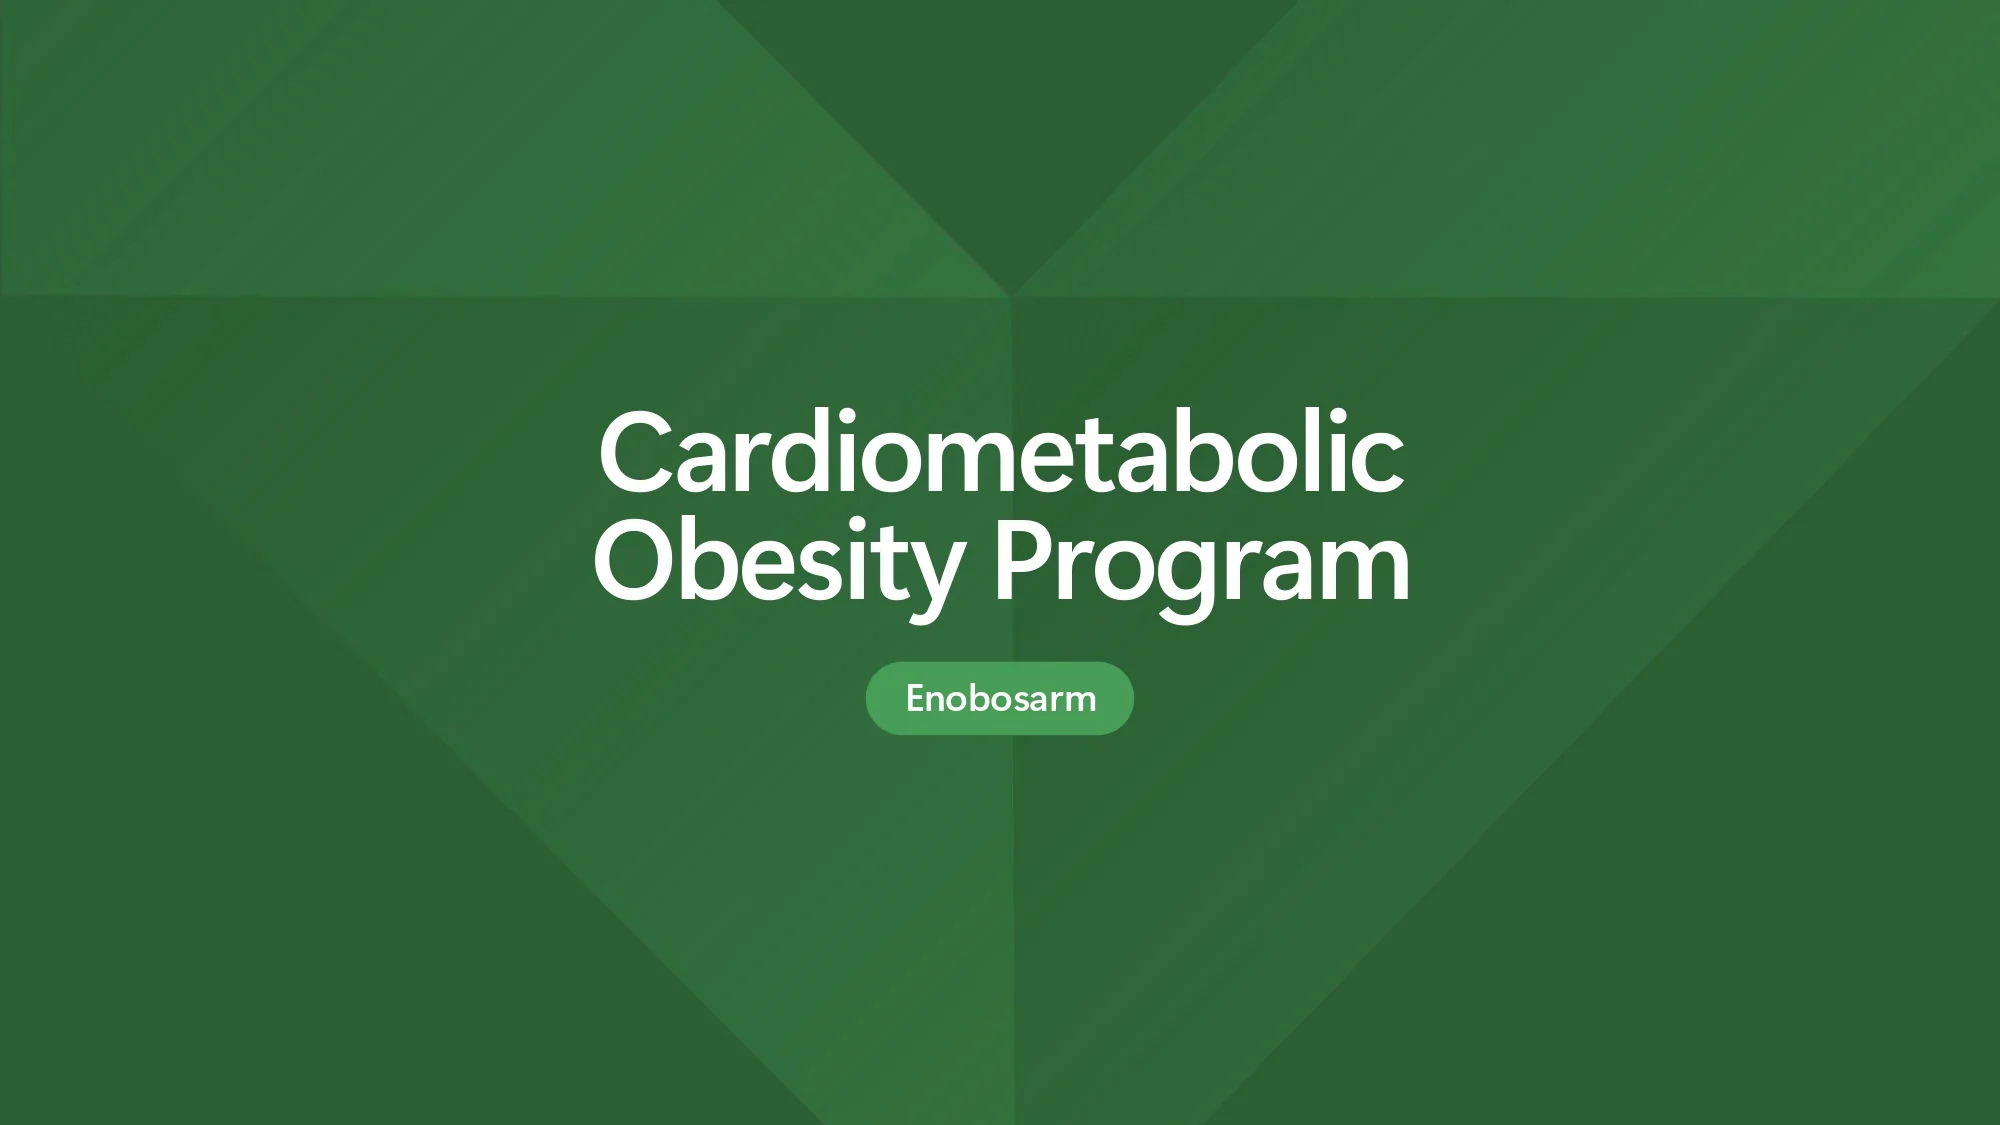
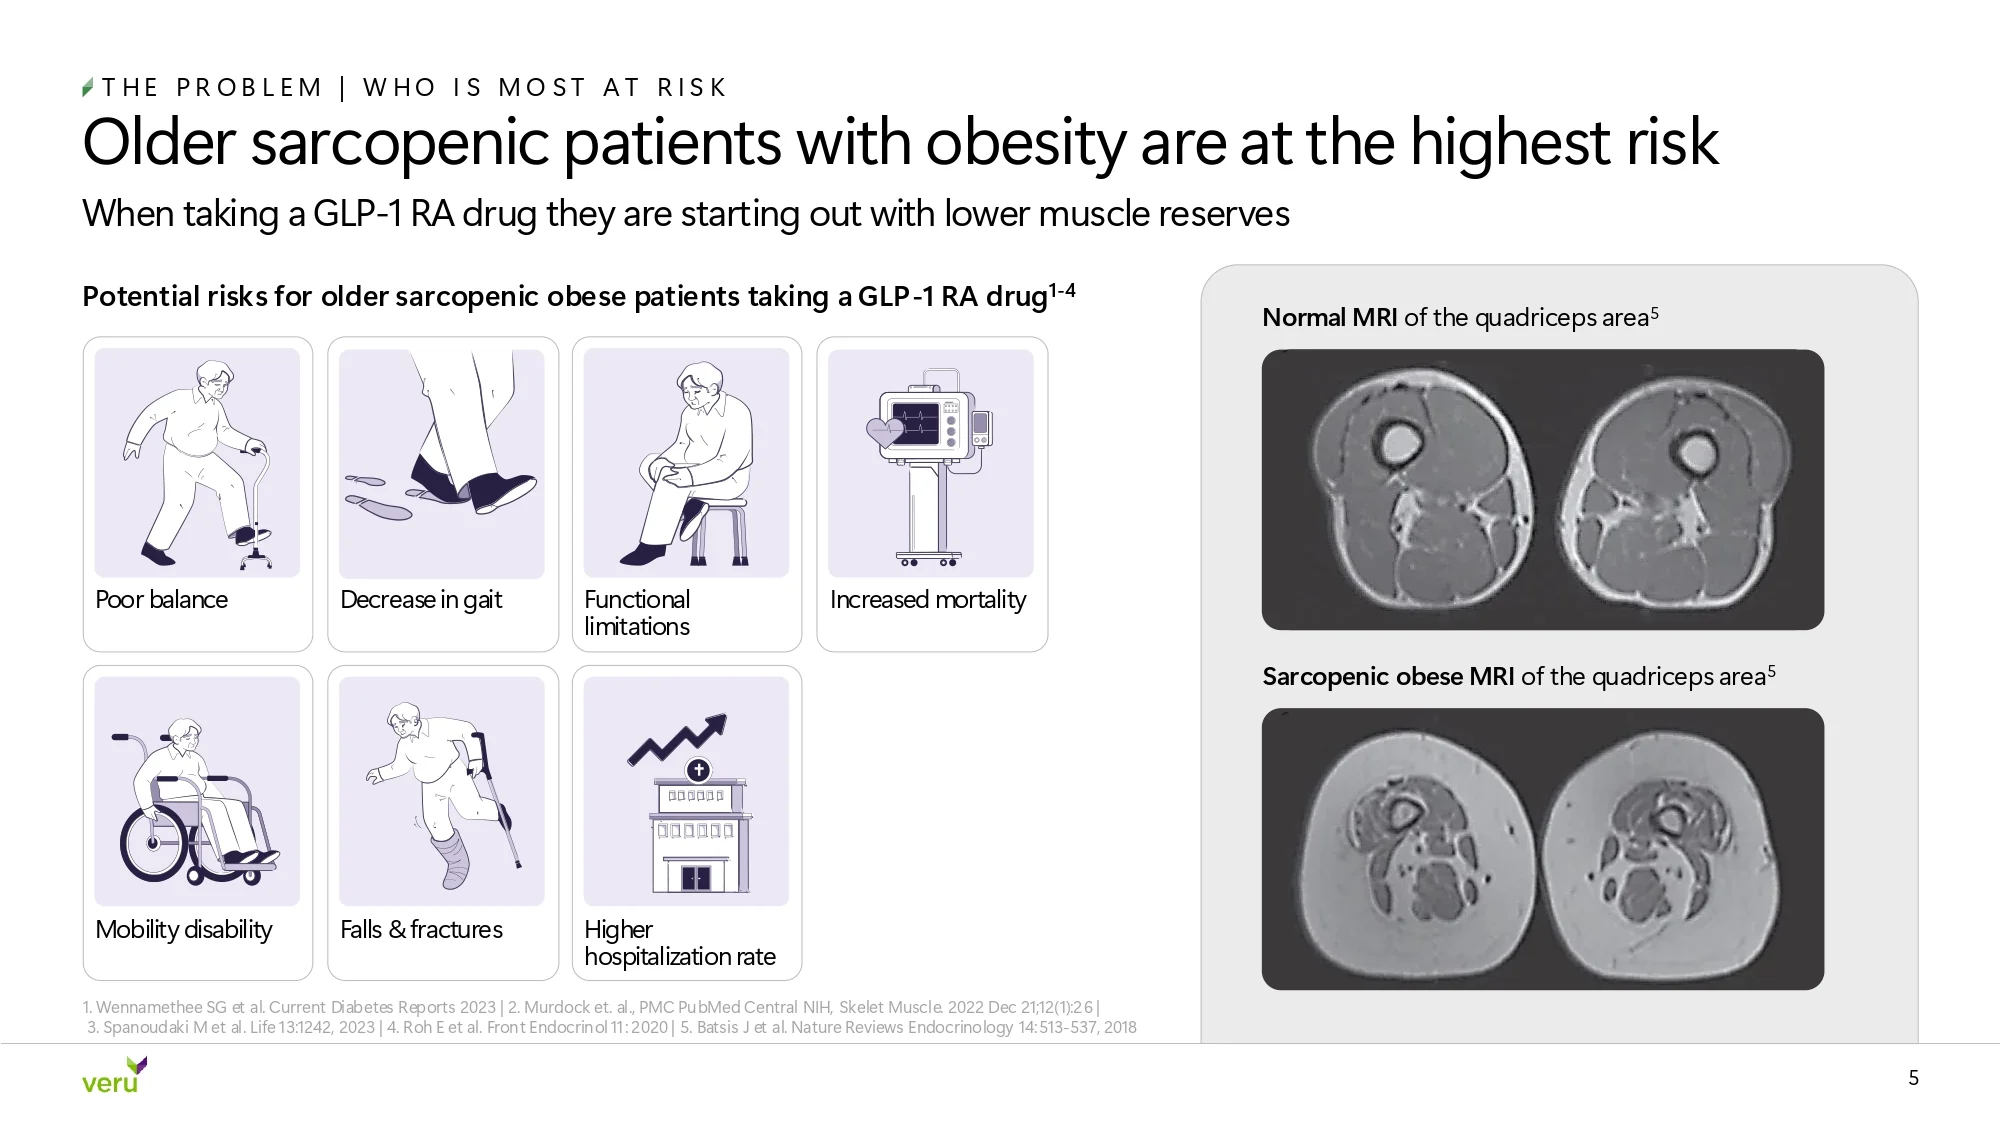
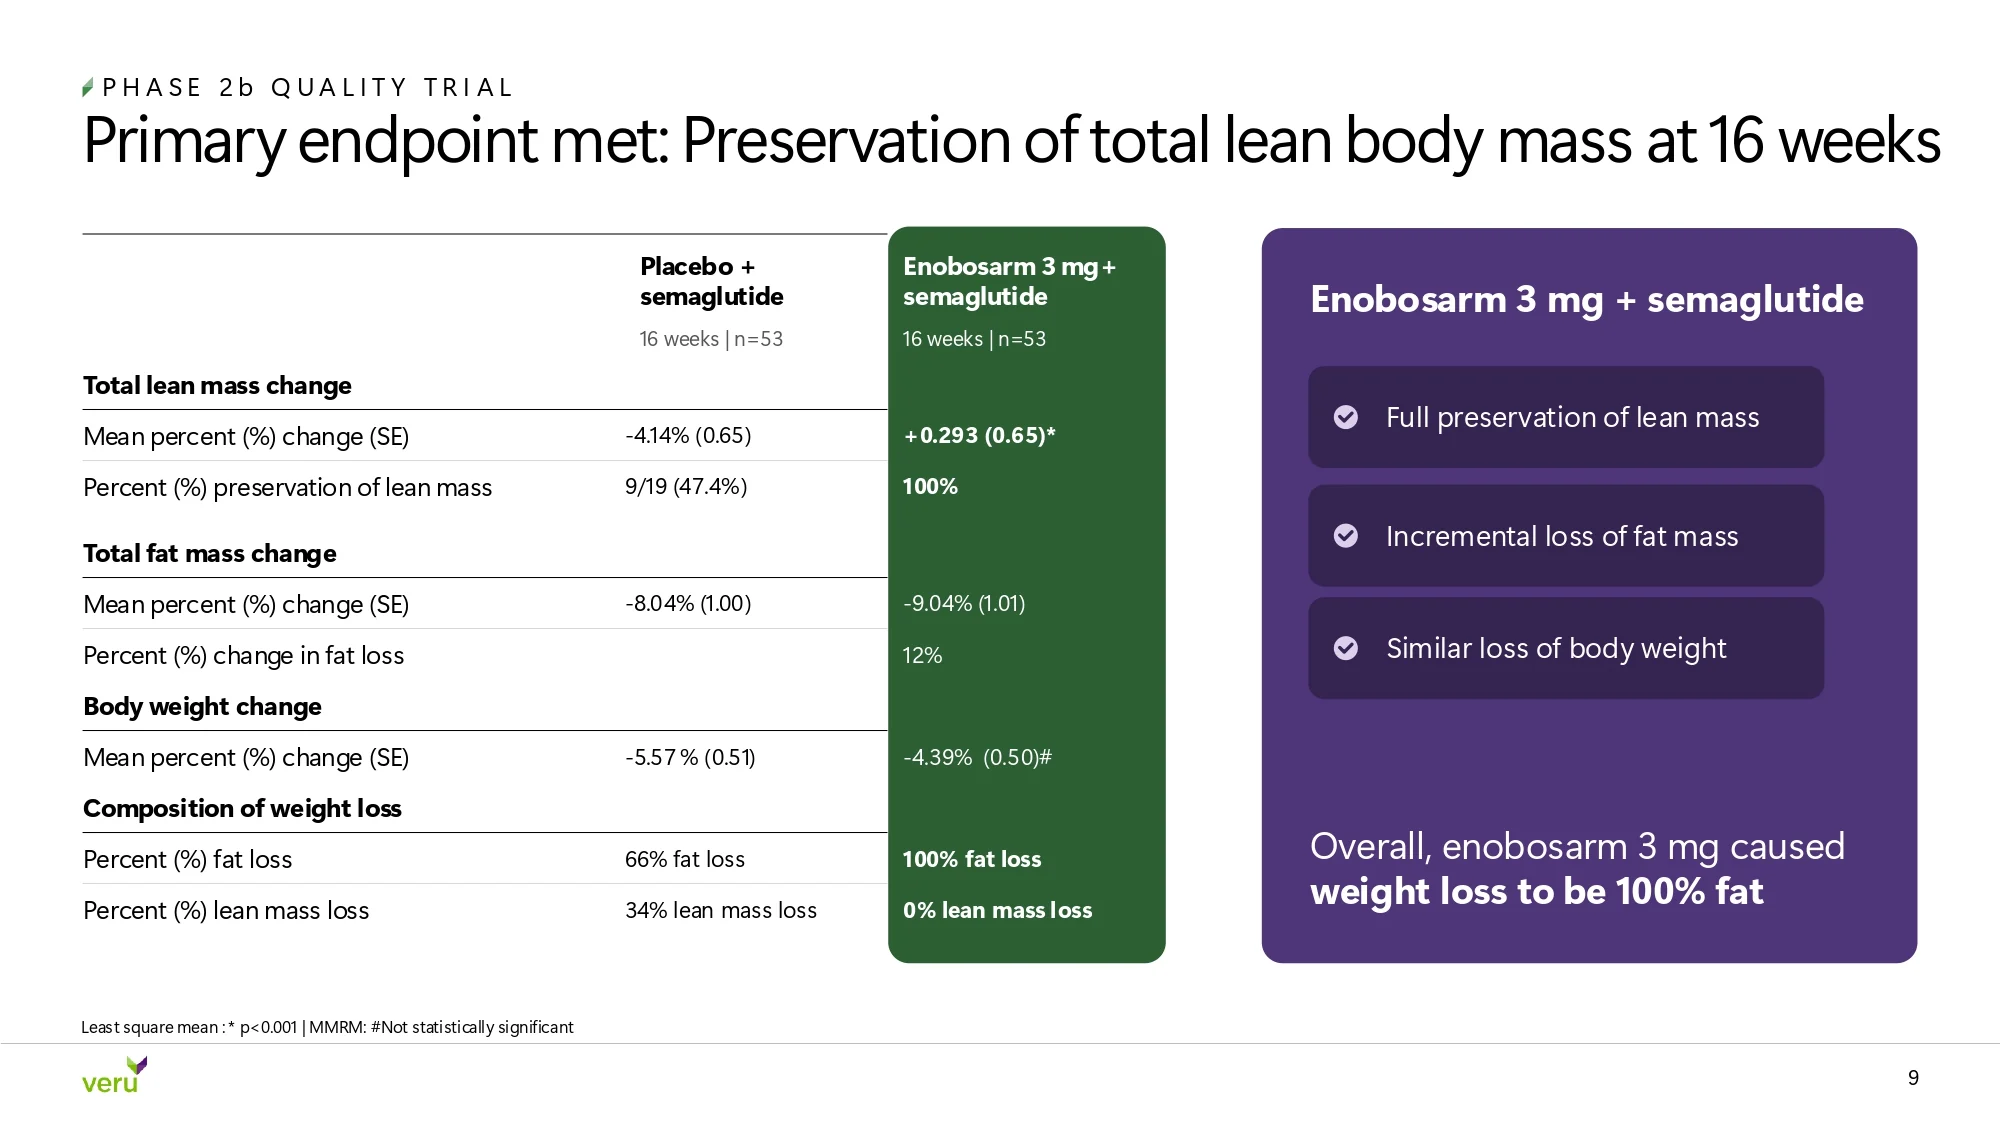
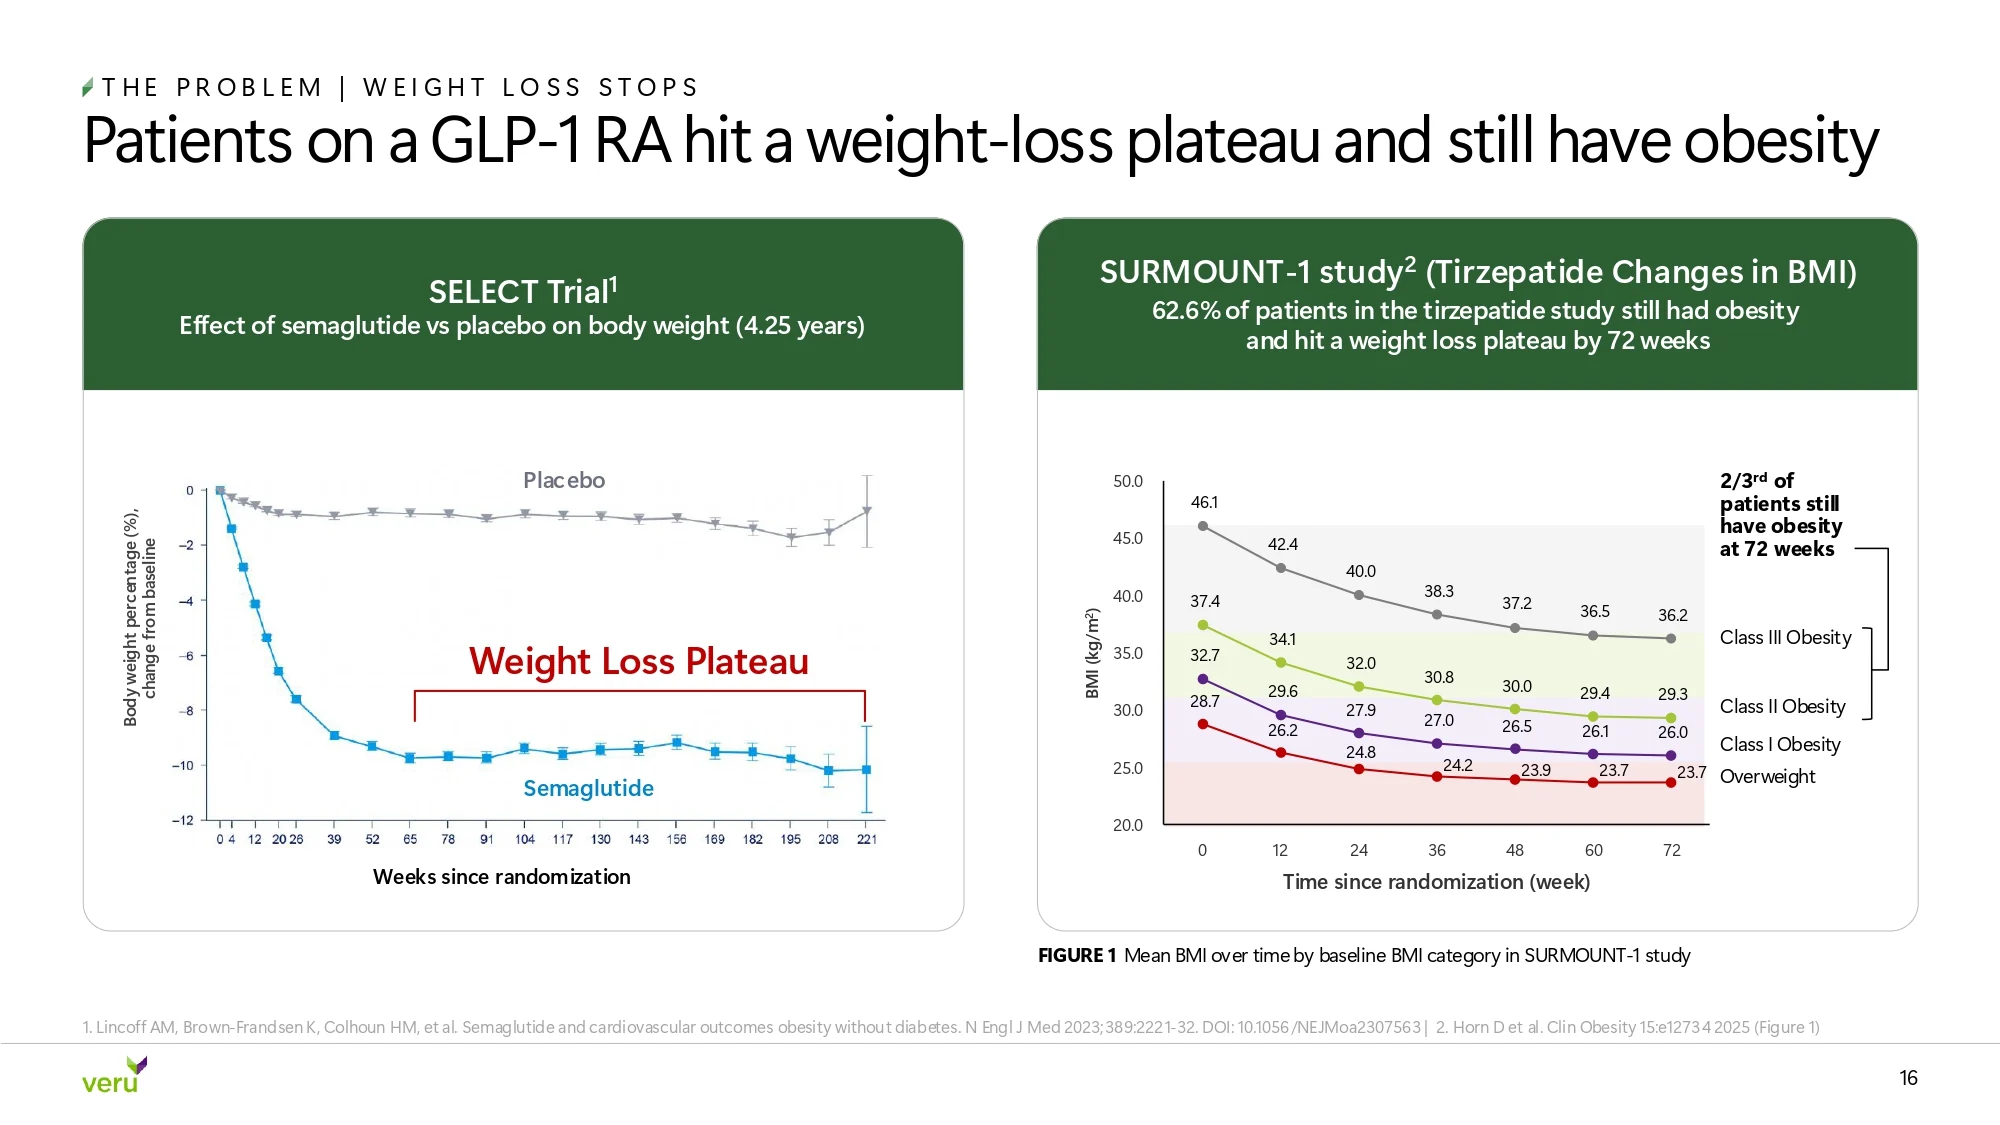
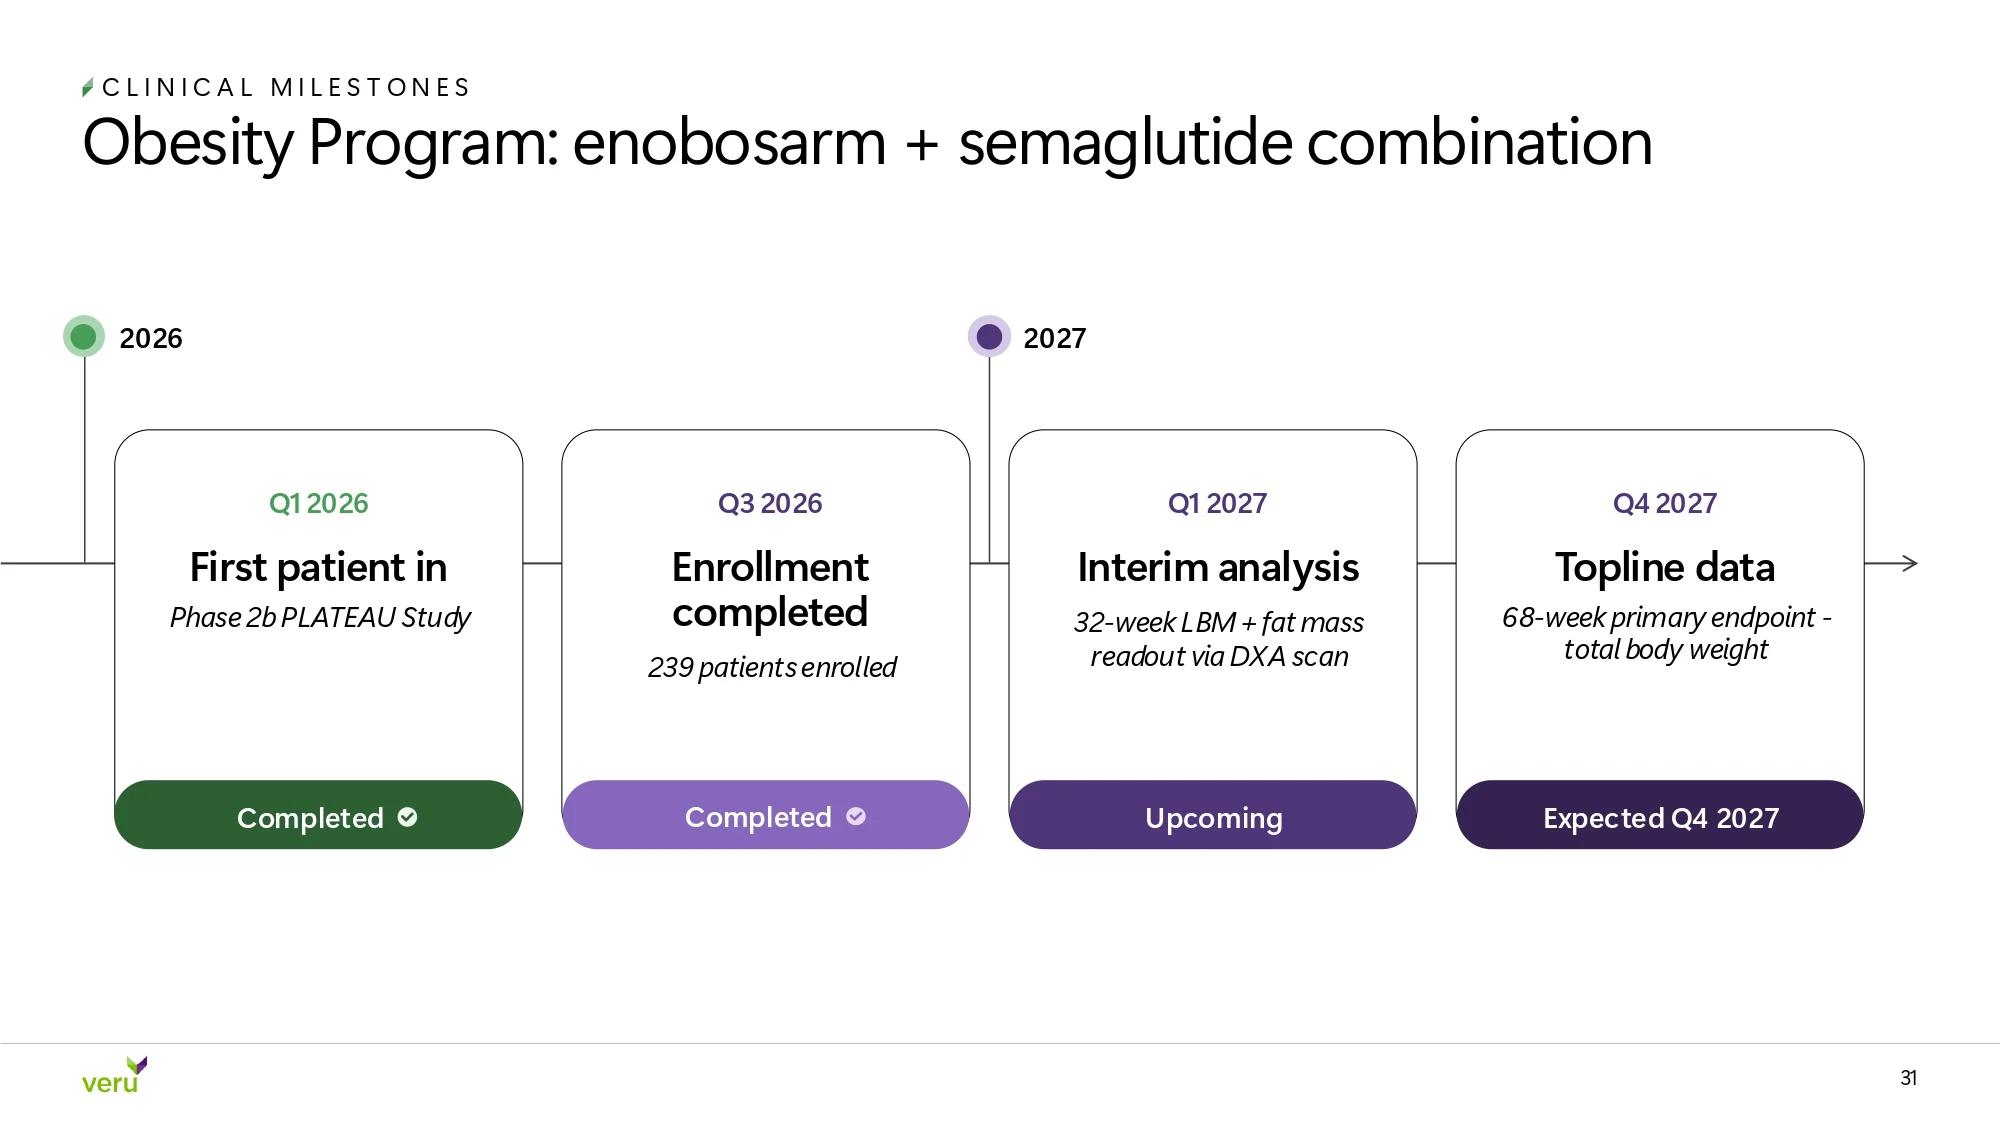


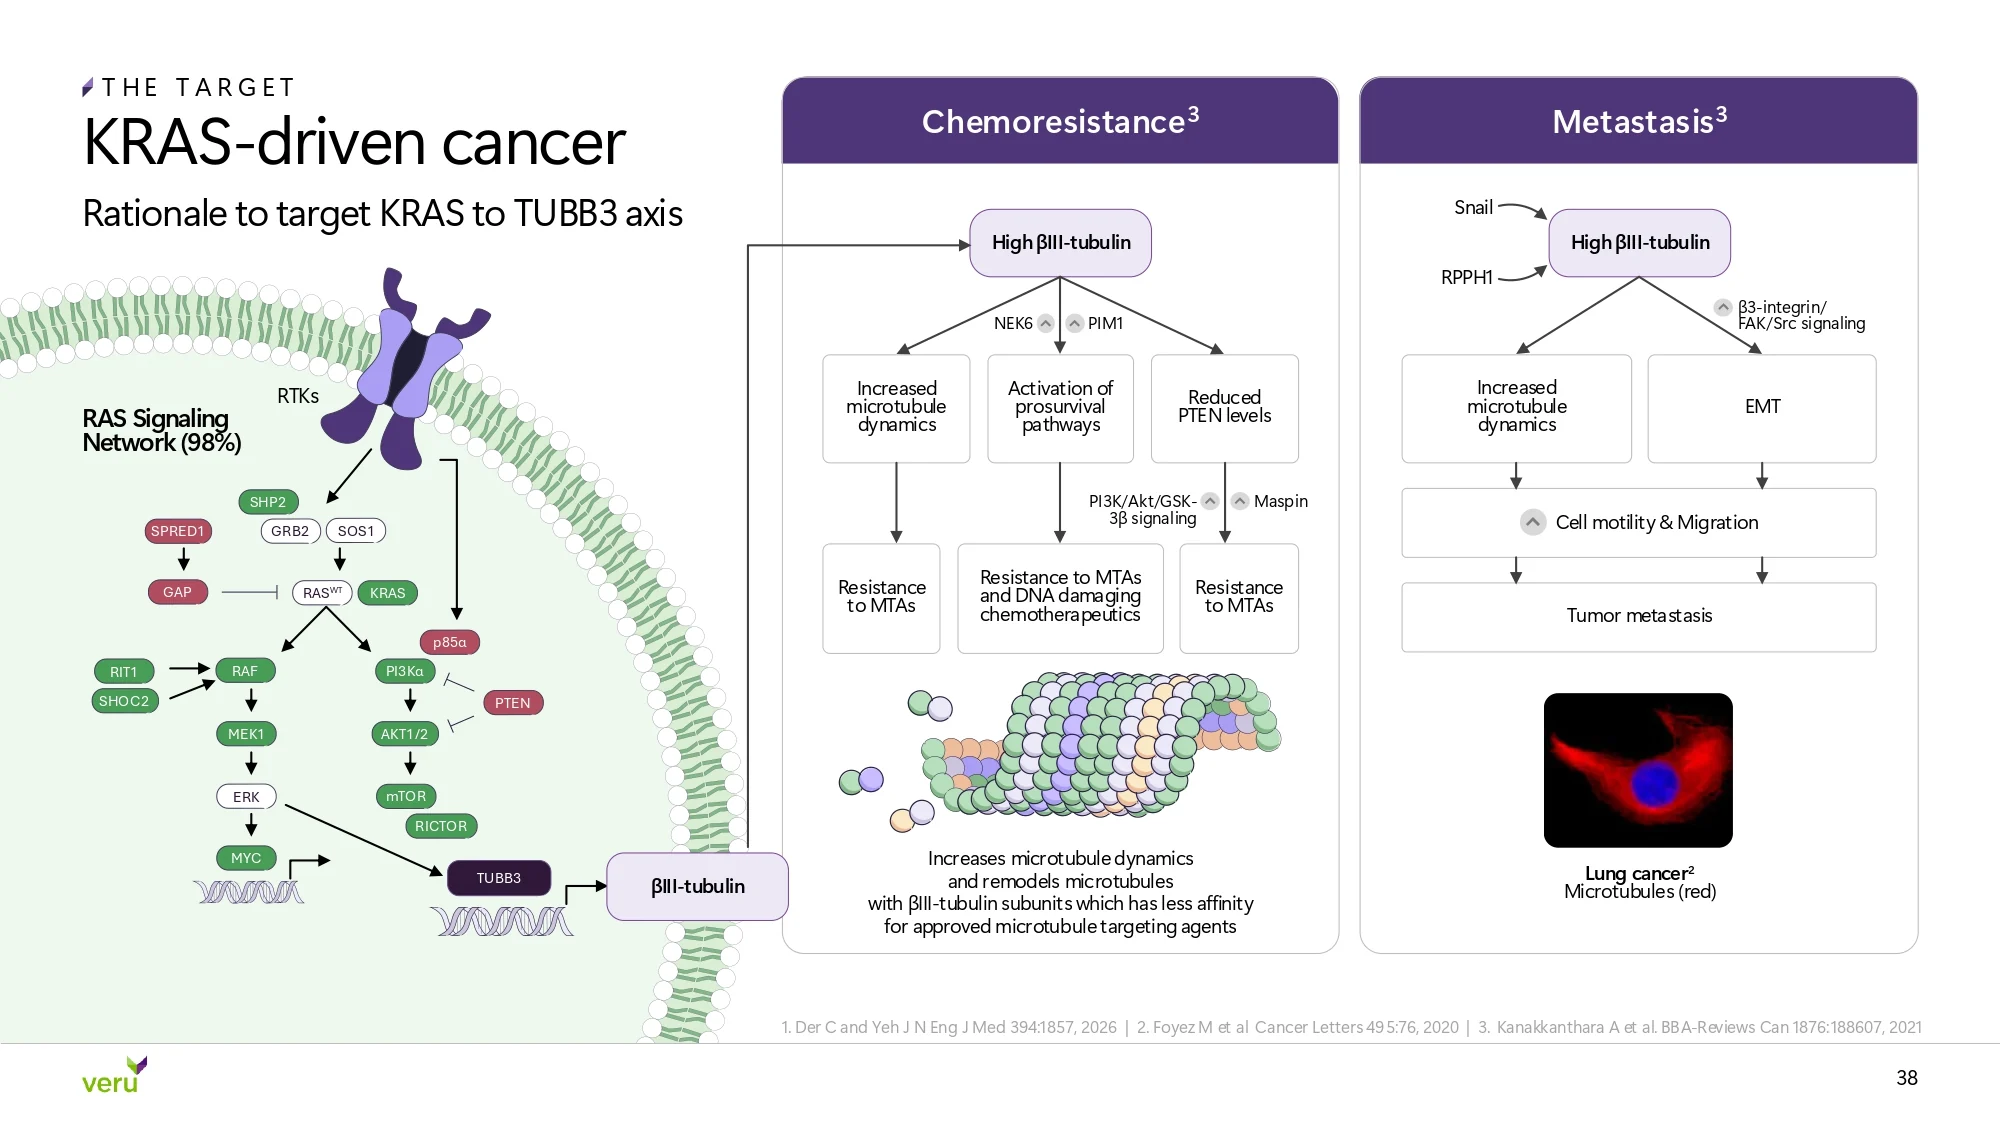

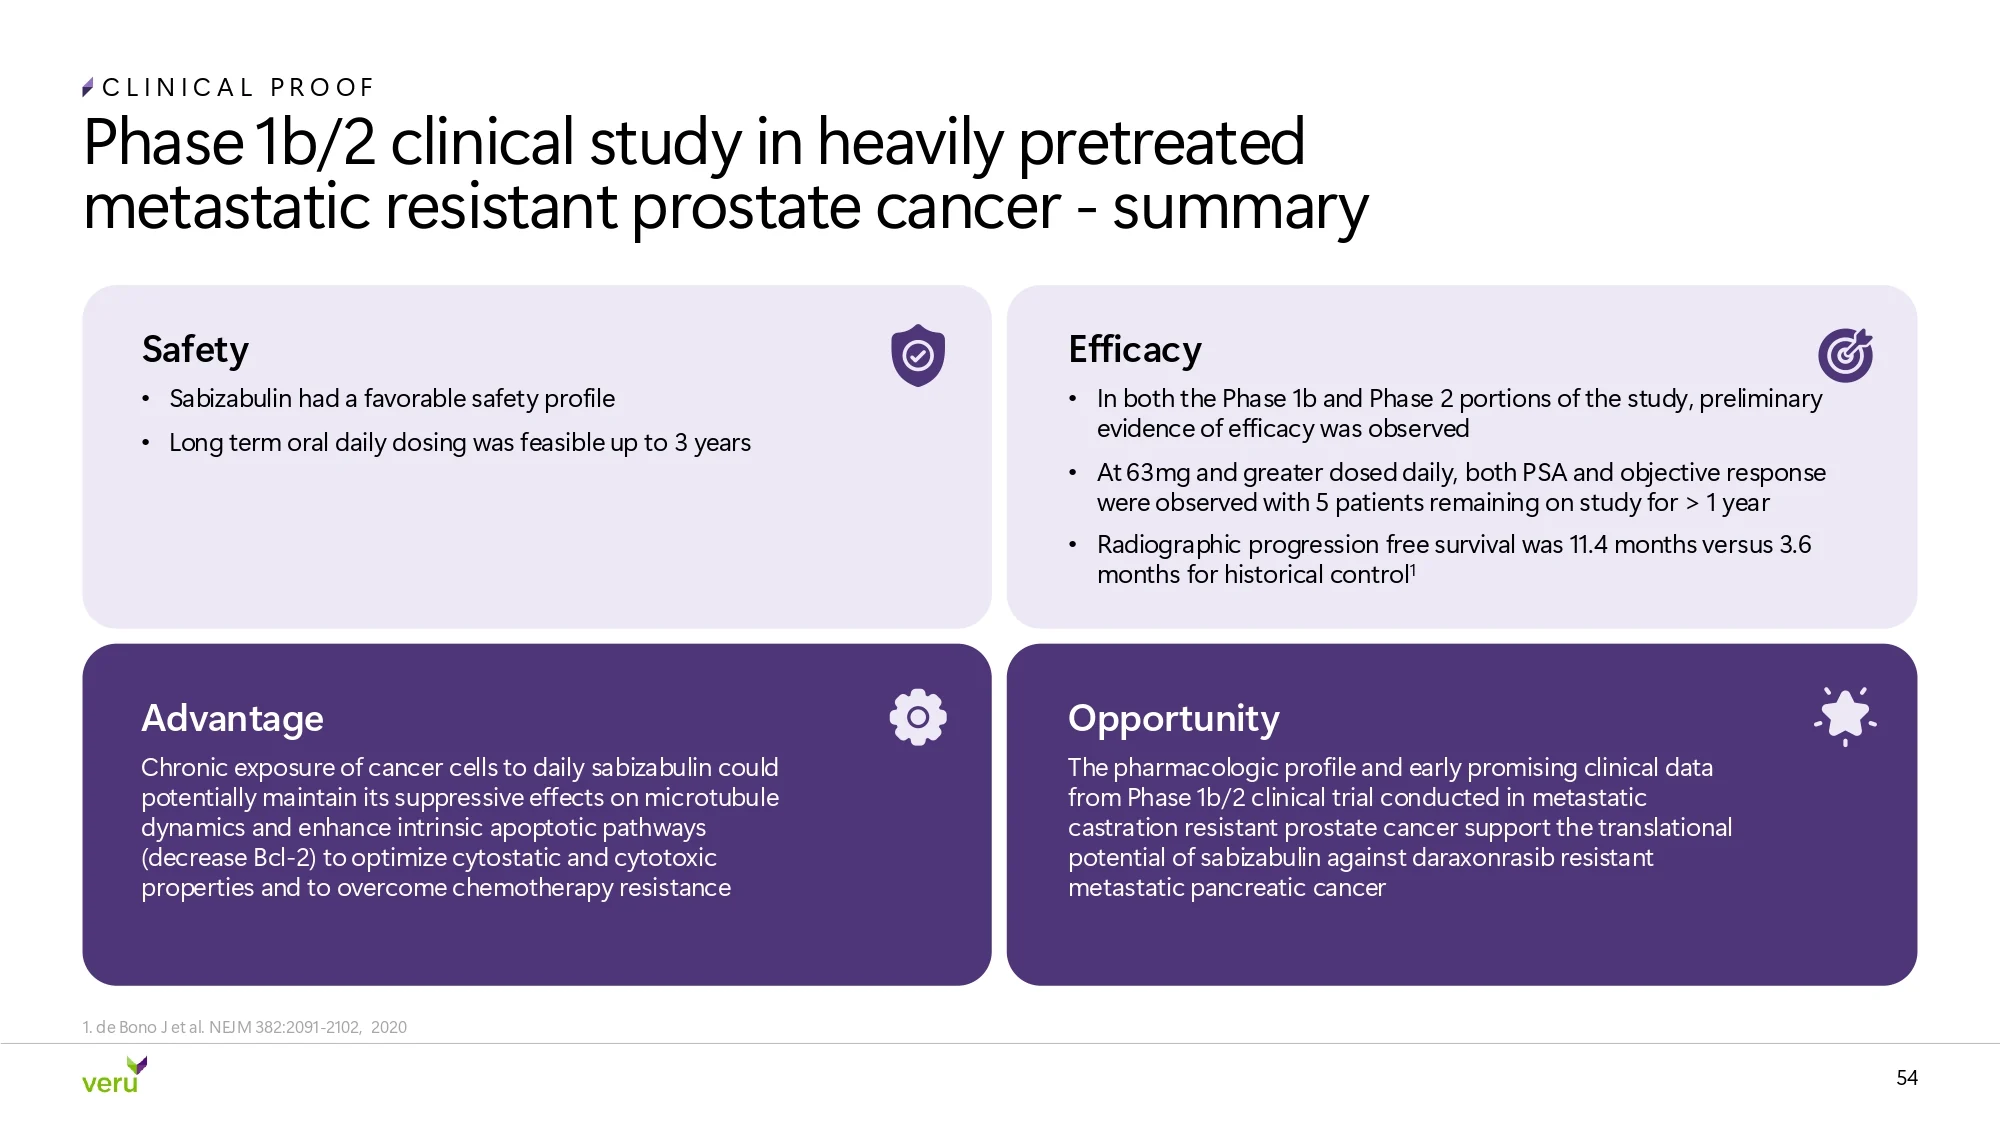
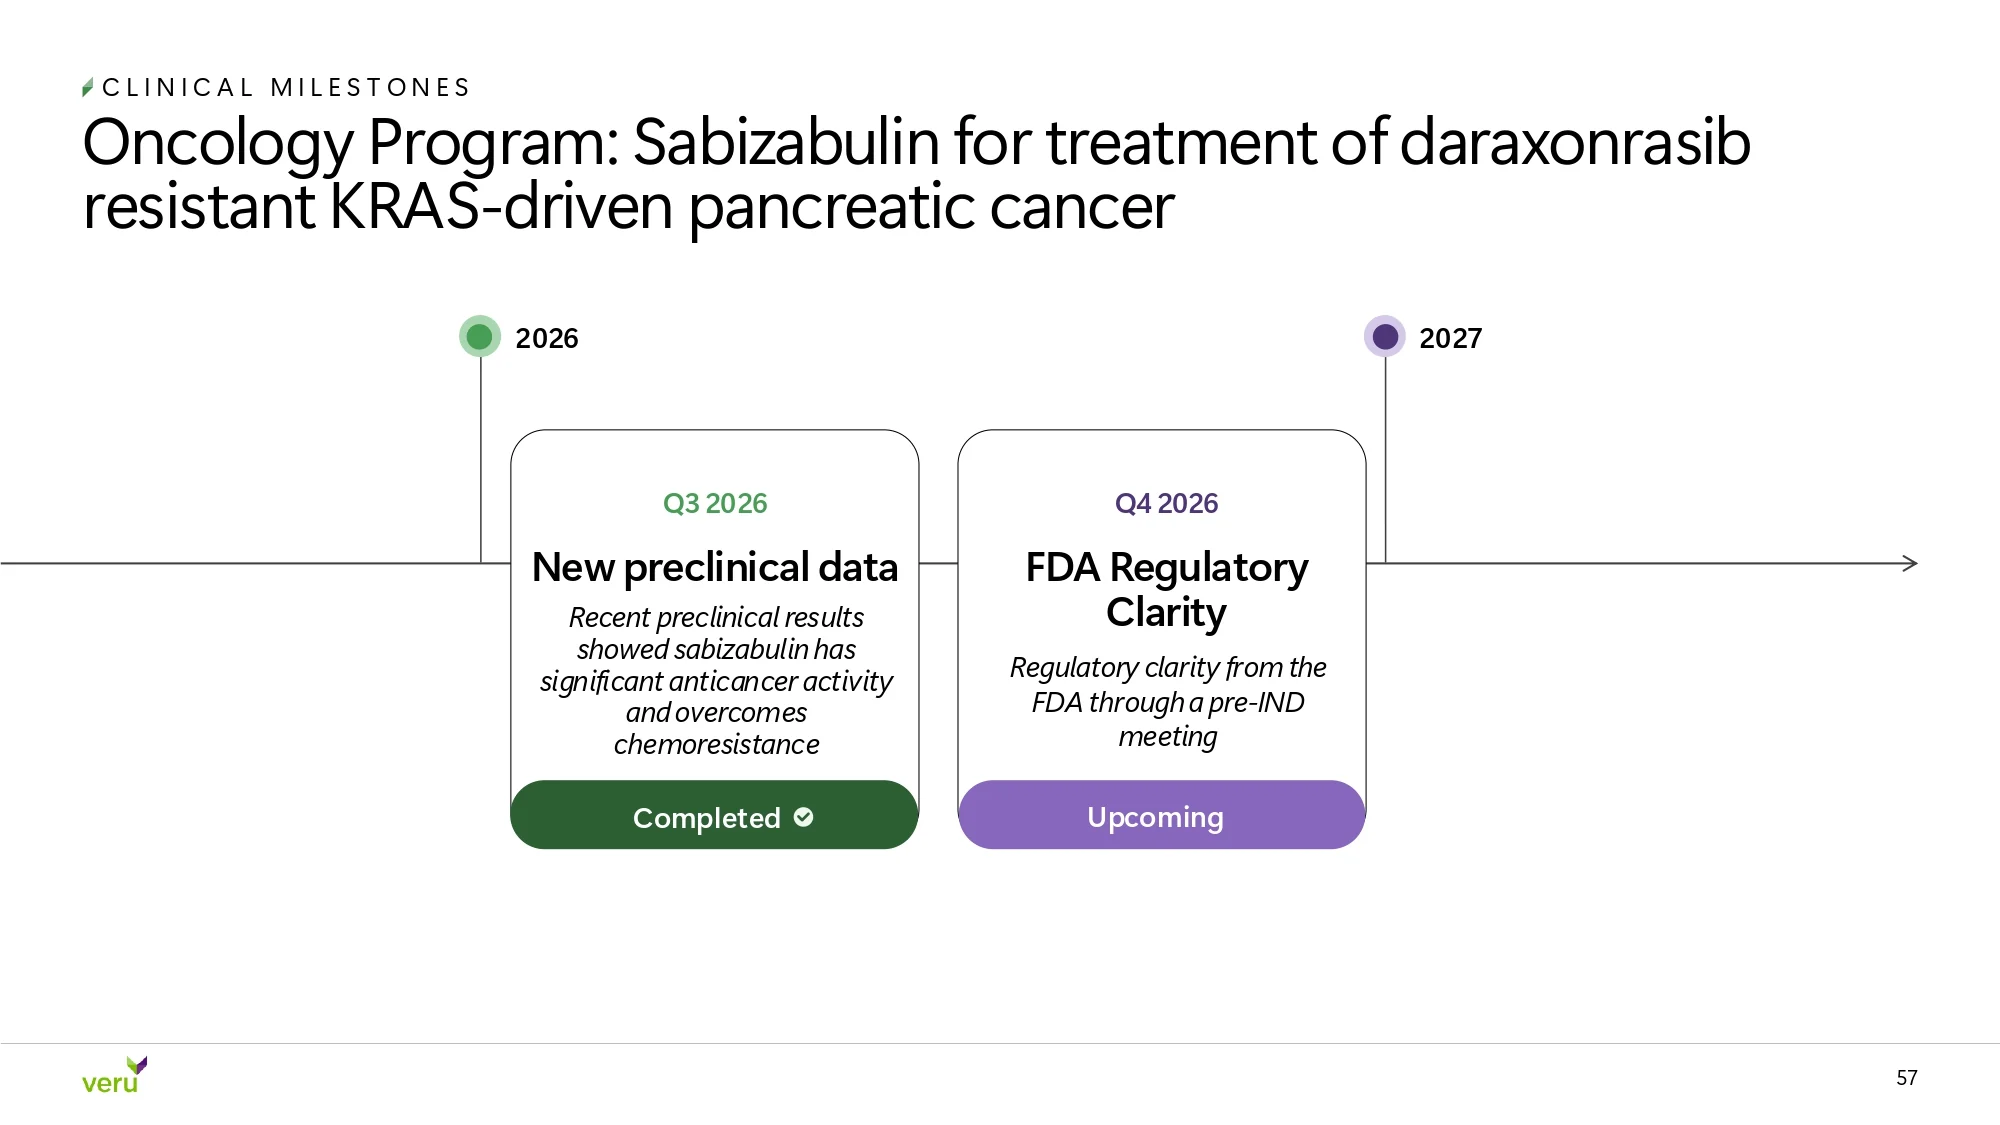



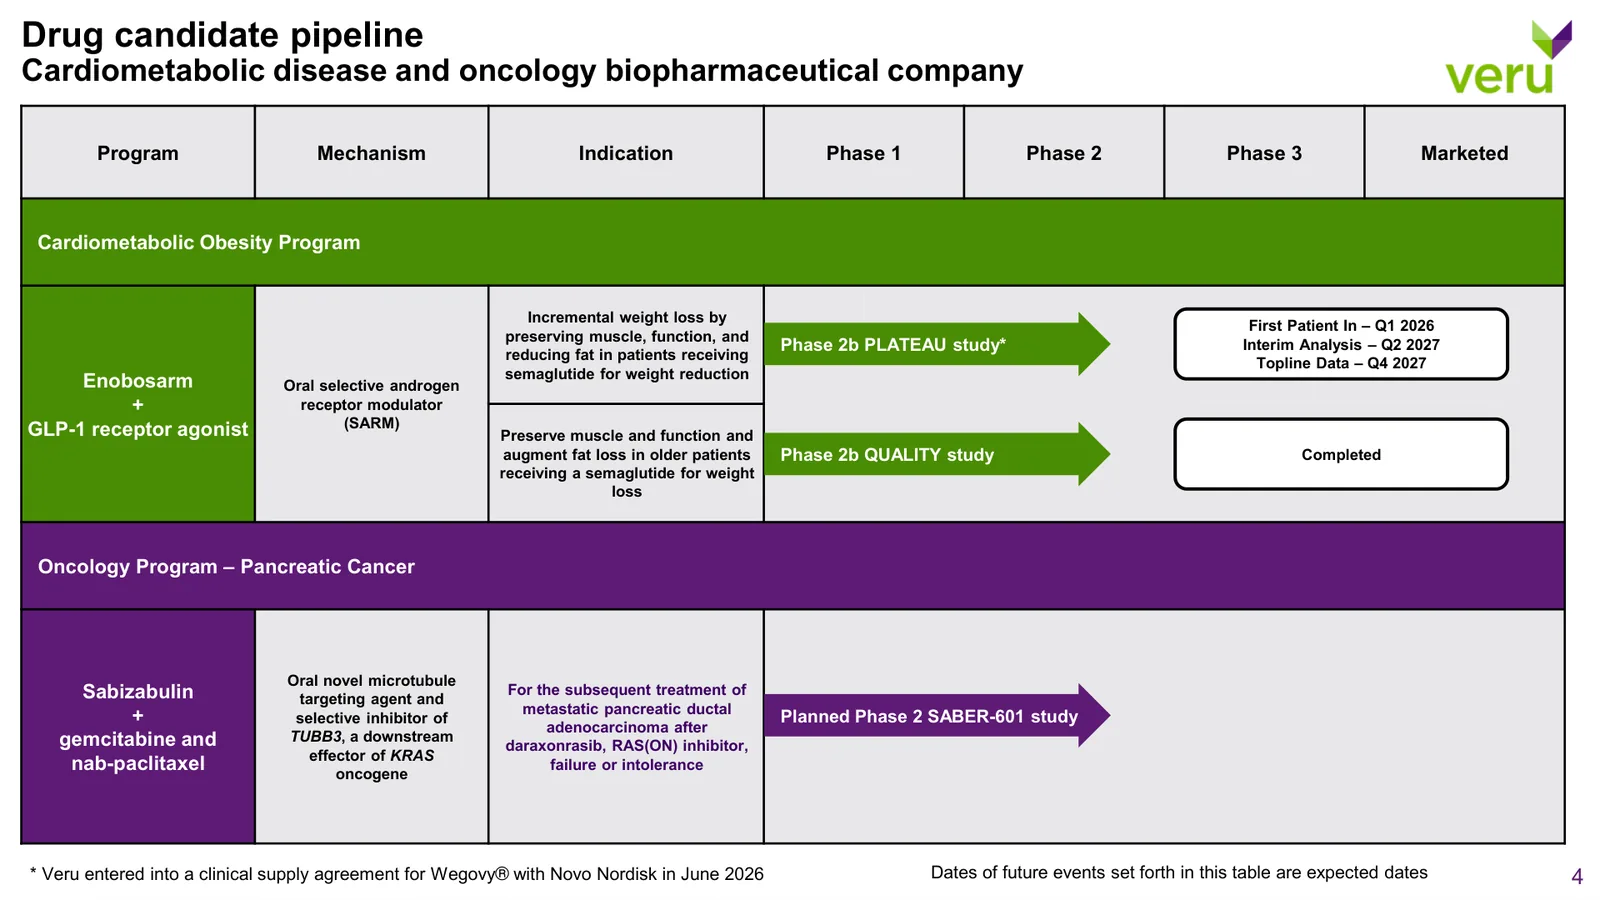
Veru's leadership wanted fewer words and more blocks. We moved supporting detail into footnotes, turned lines of data into blocks and charts, and kept type bold so it reads on conference-room screens. Hunter green carries the cardiometabolic program and Veru purple carries oncology.
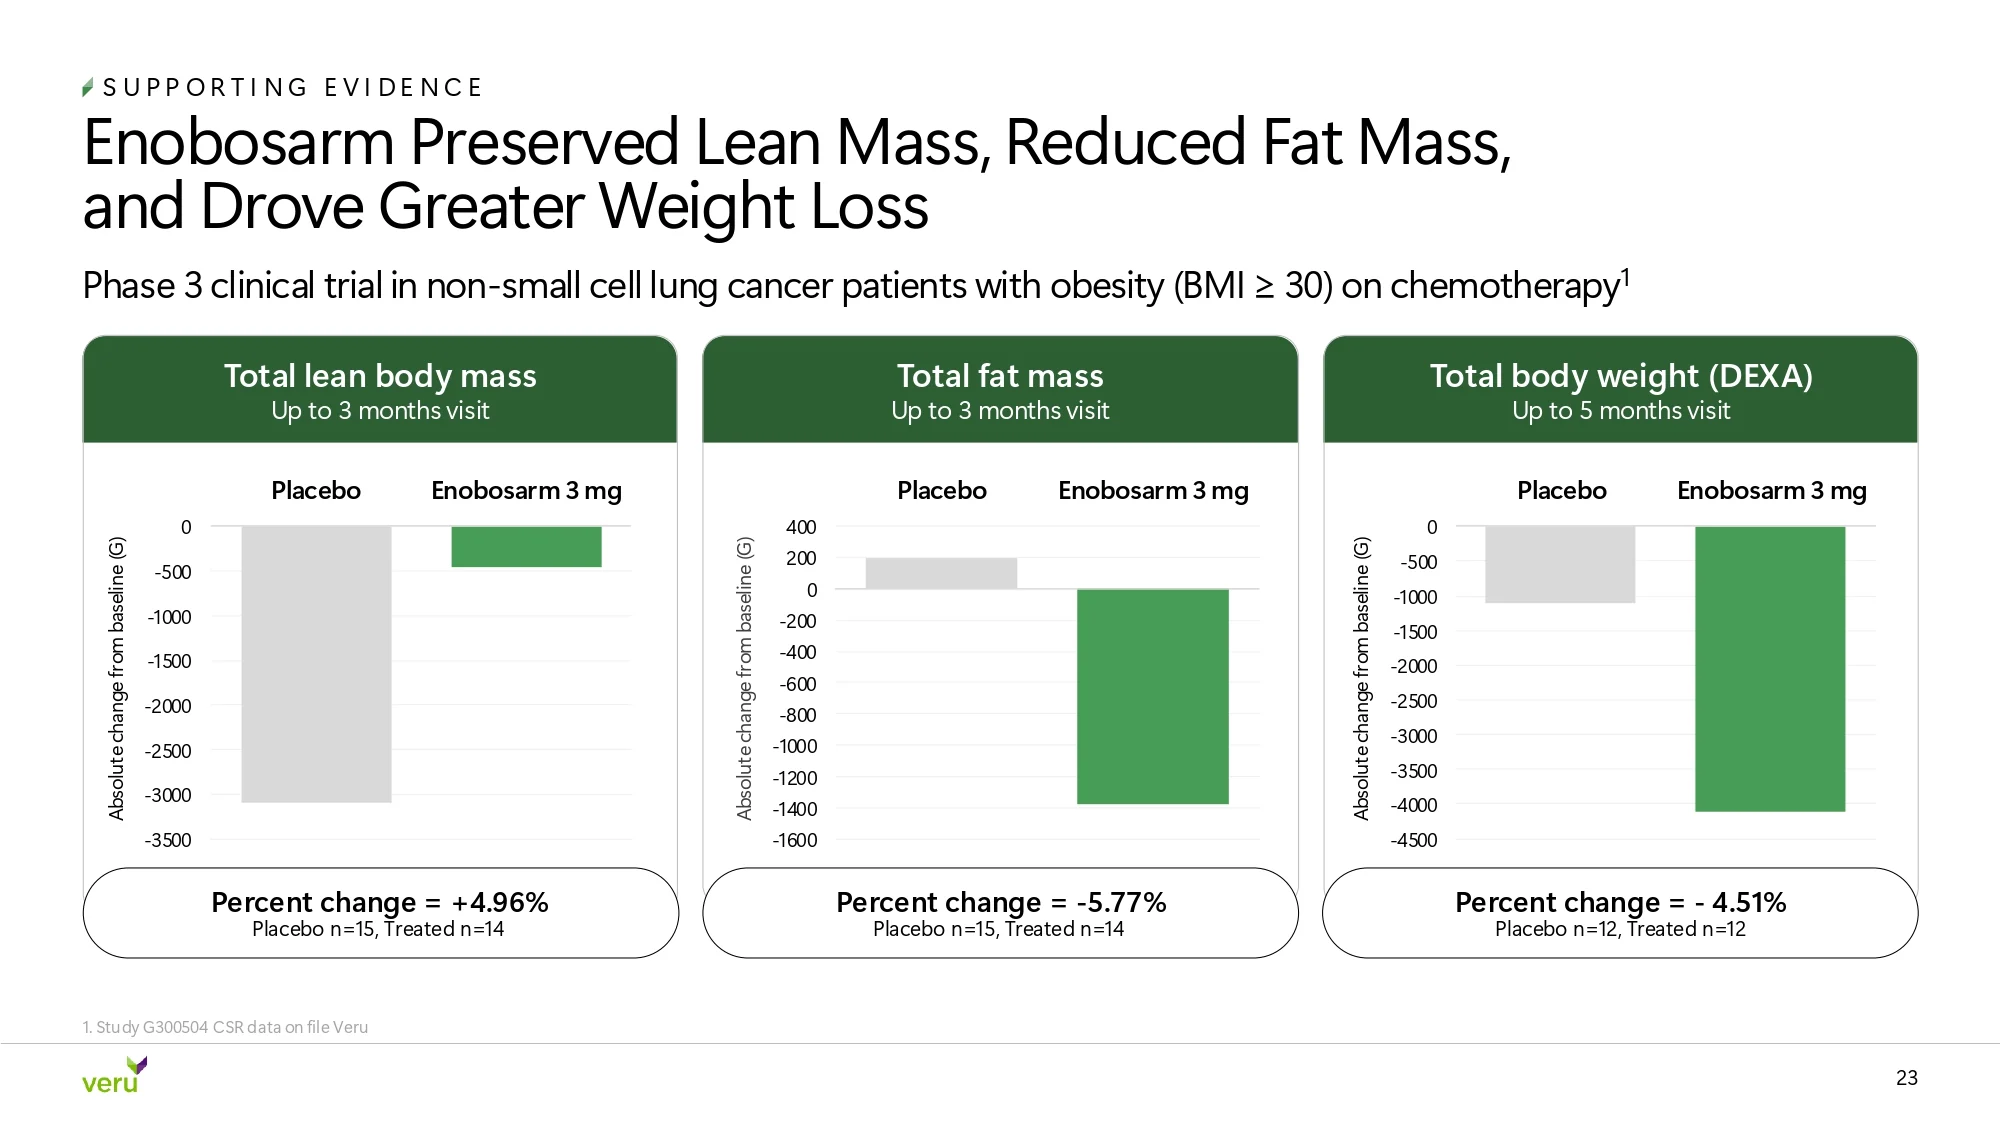
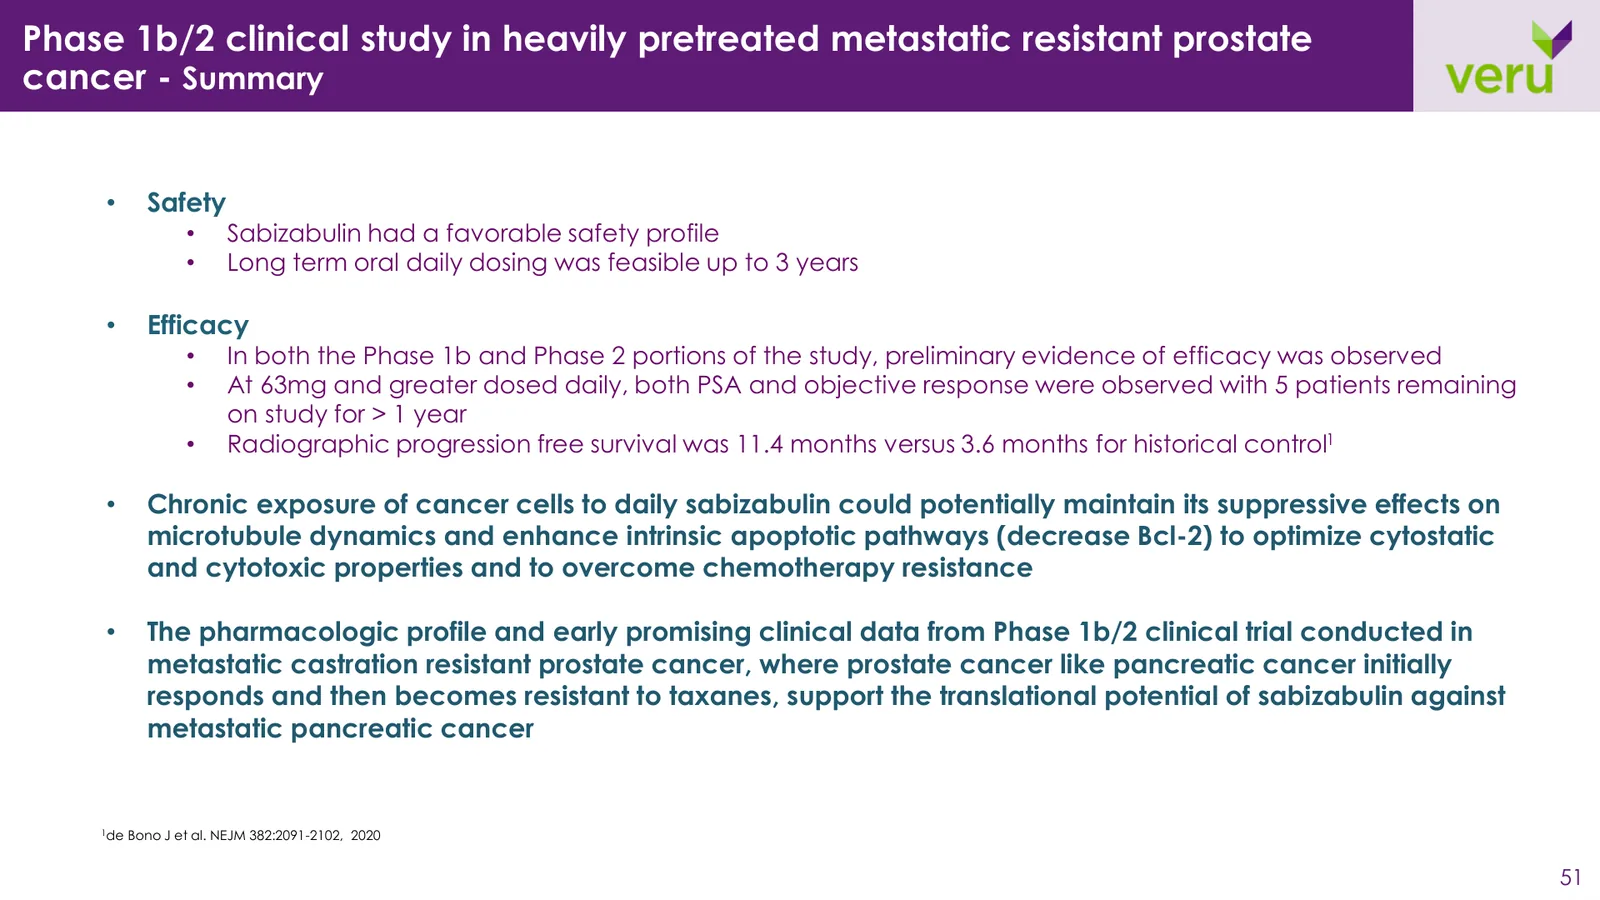
We rebuilt the slides that do the most work in investor conversations. Titles now state the conclusion, tables highlight the result that matters, charts are redrawn in brand colors, and text-heavy slides became structured blocks.
Improvements
Clear Takeaways
Blocks over Bullets
Data Visualization
Investor Ready



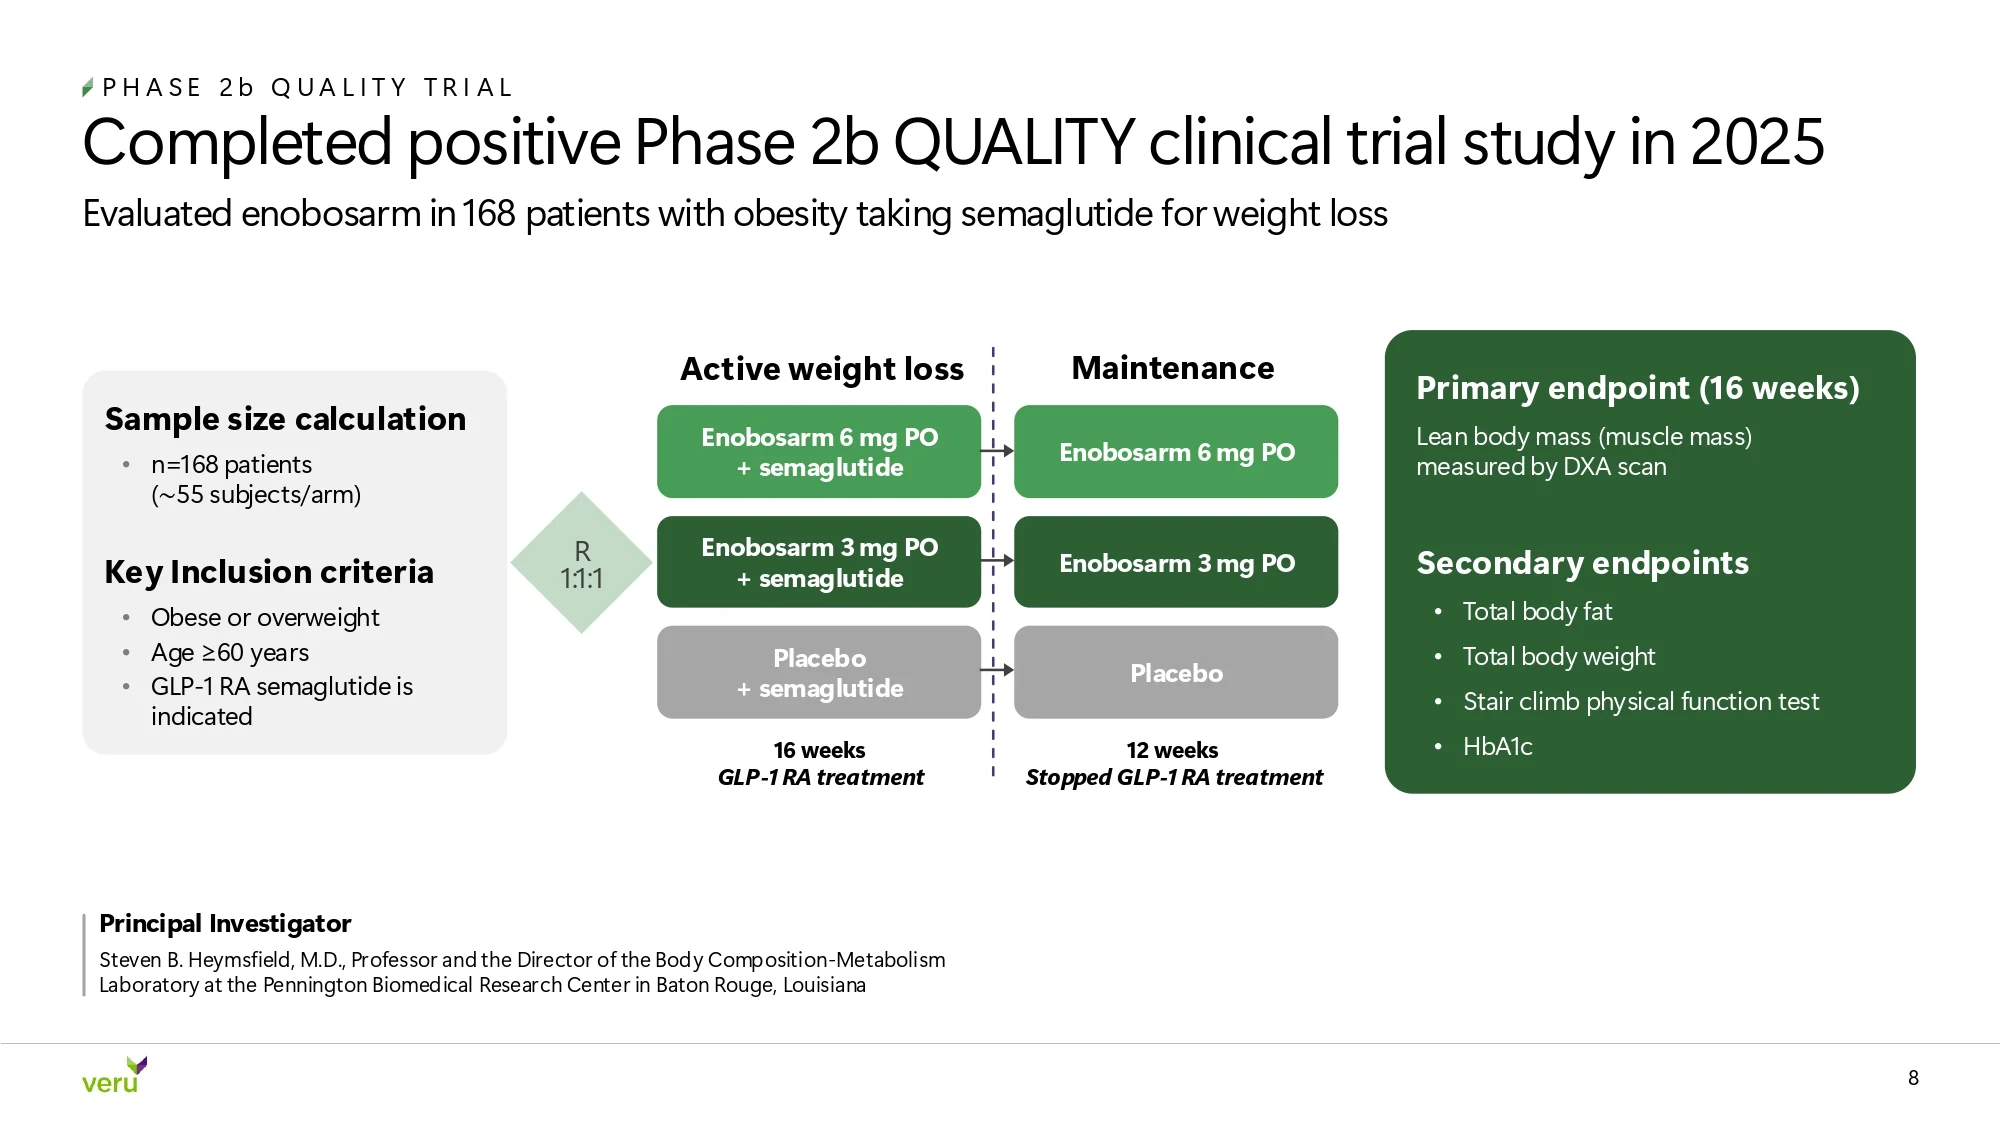
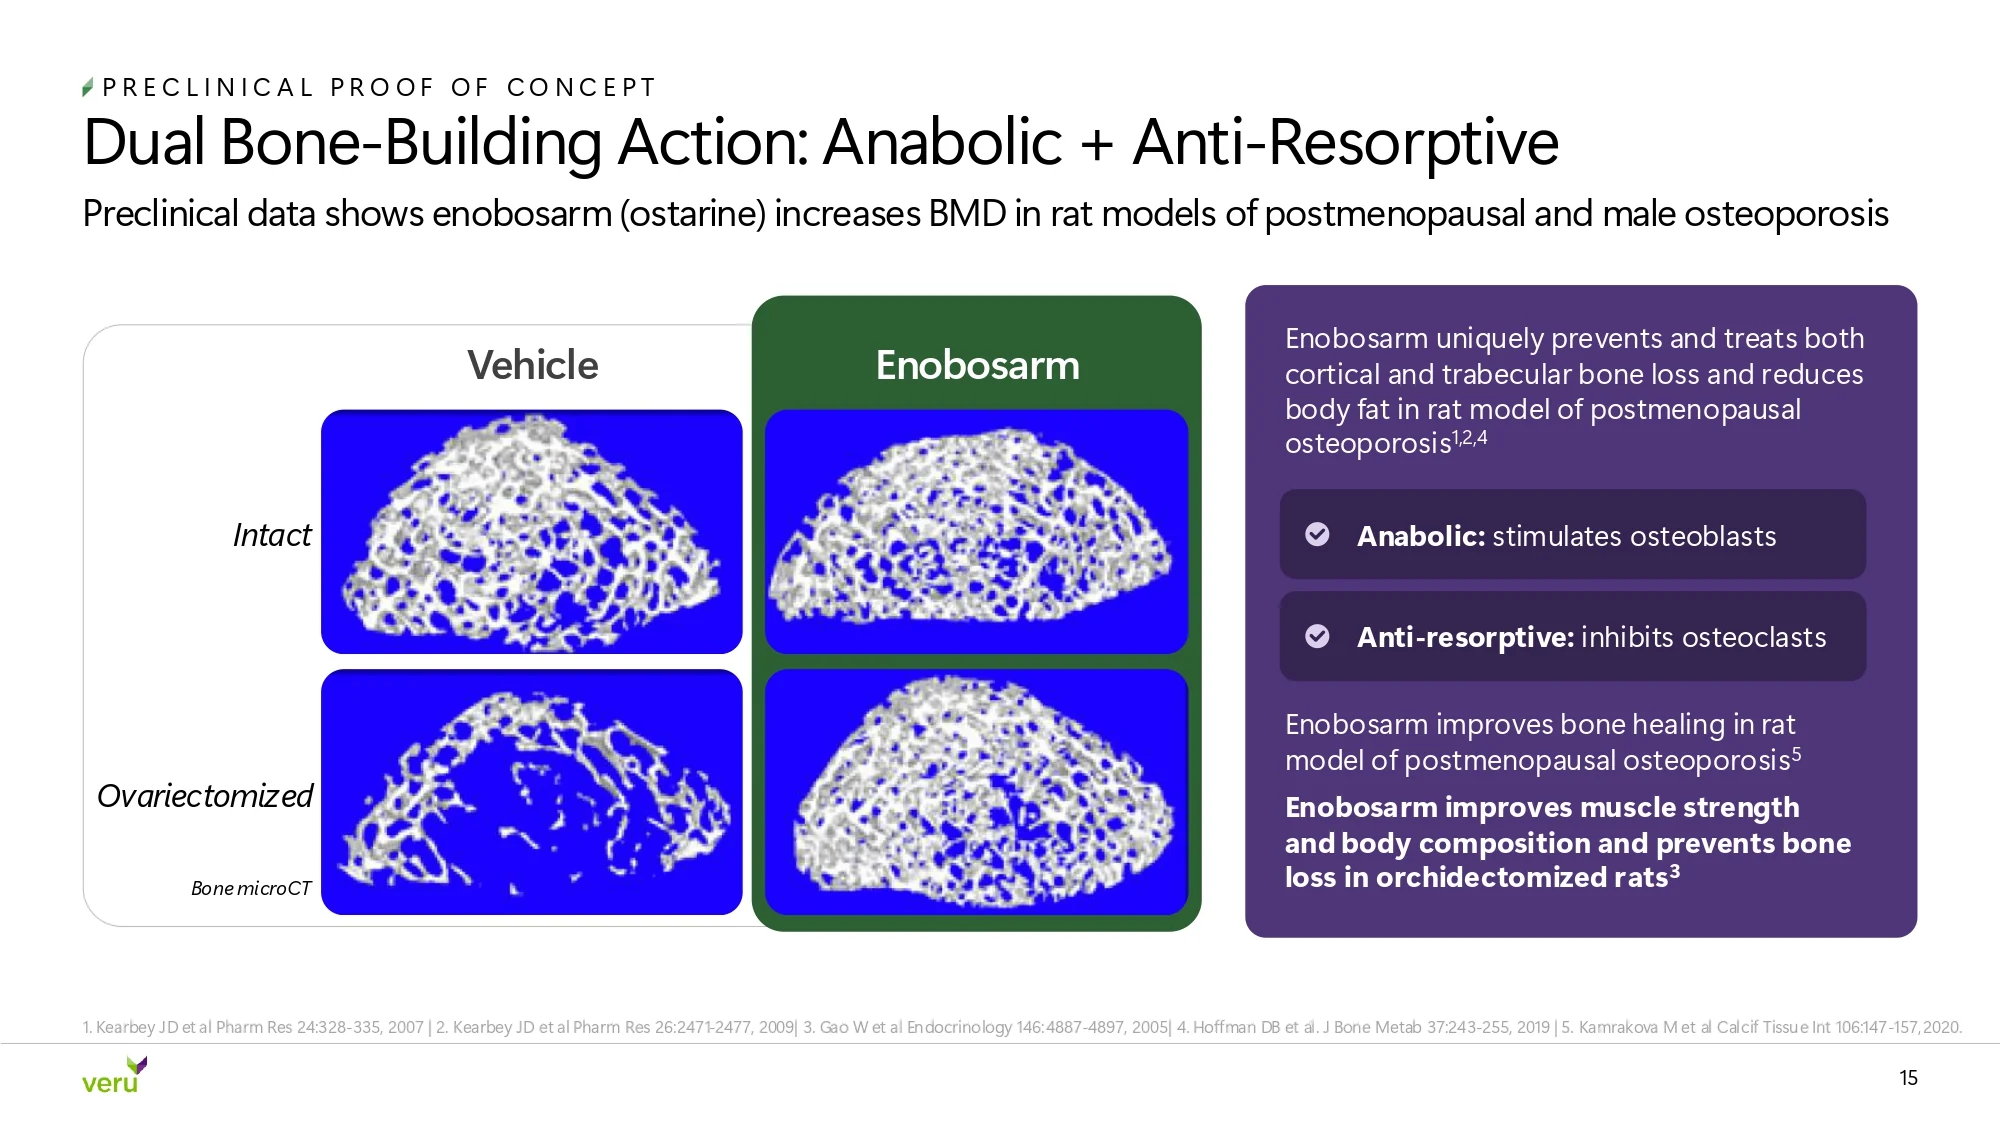
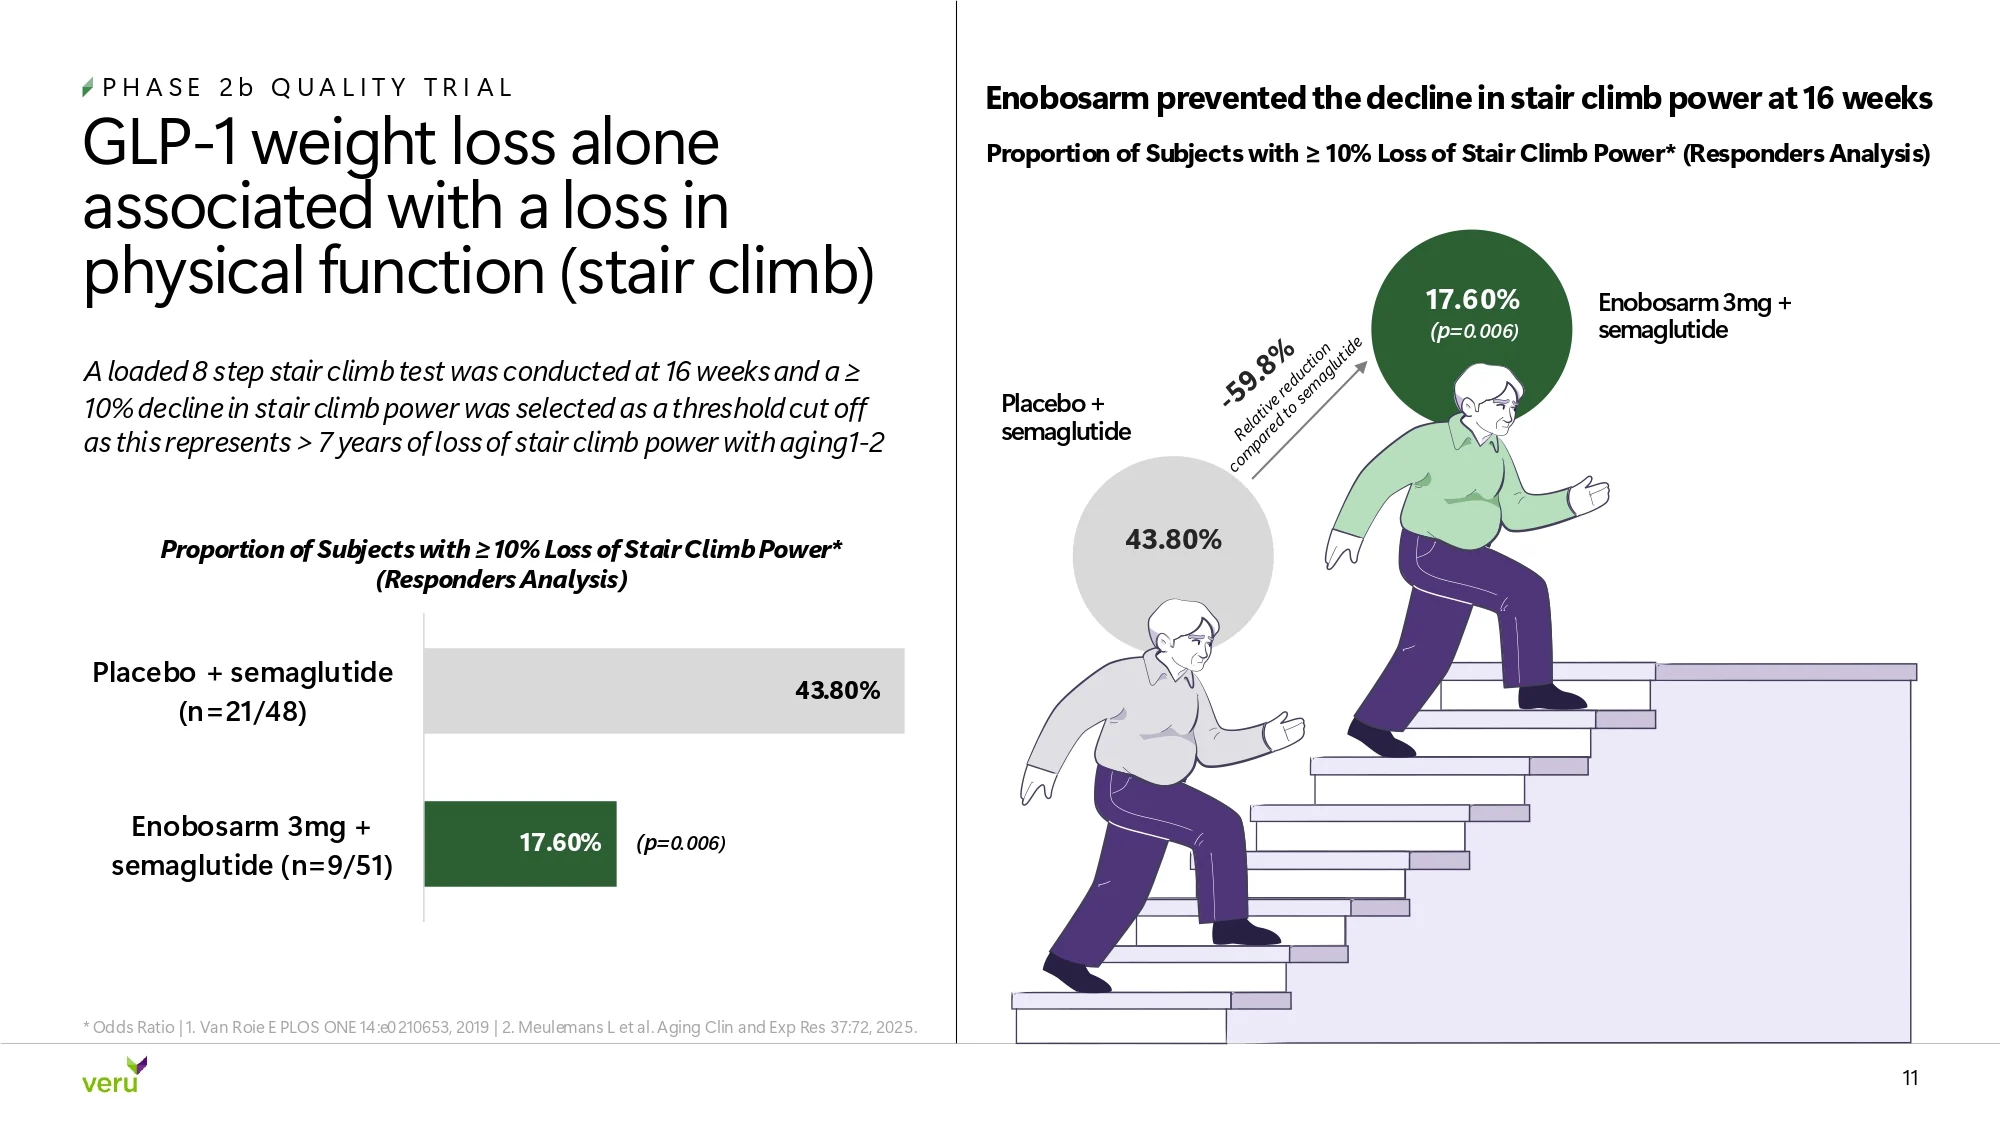
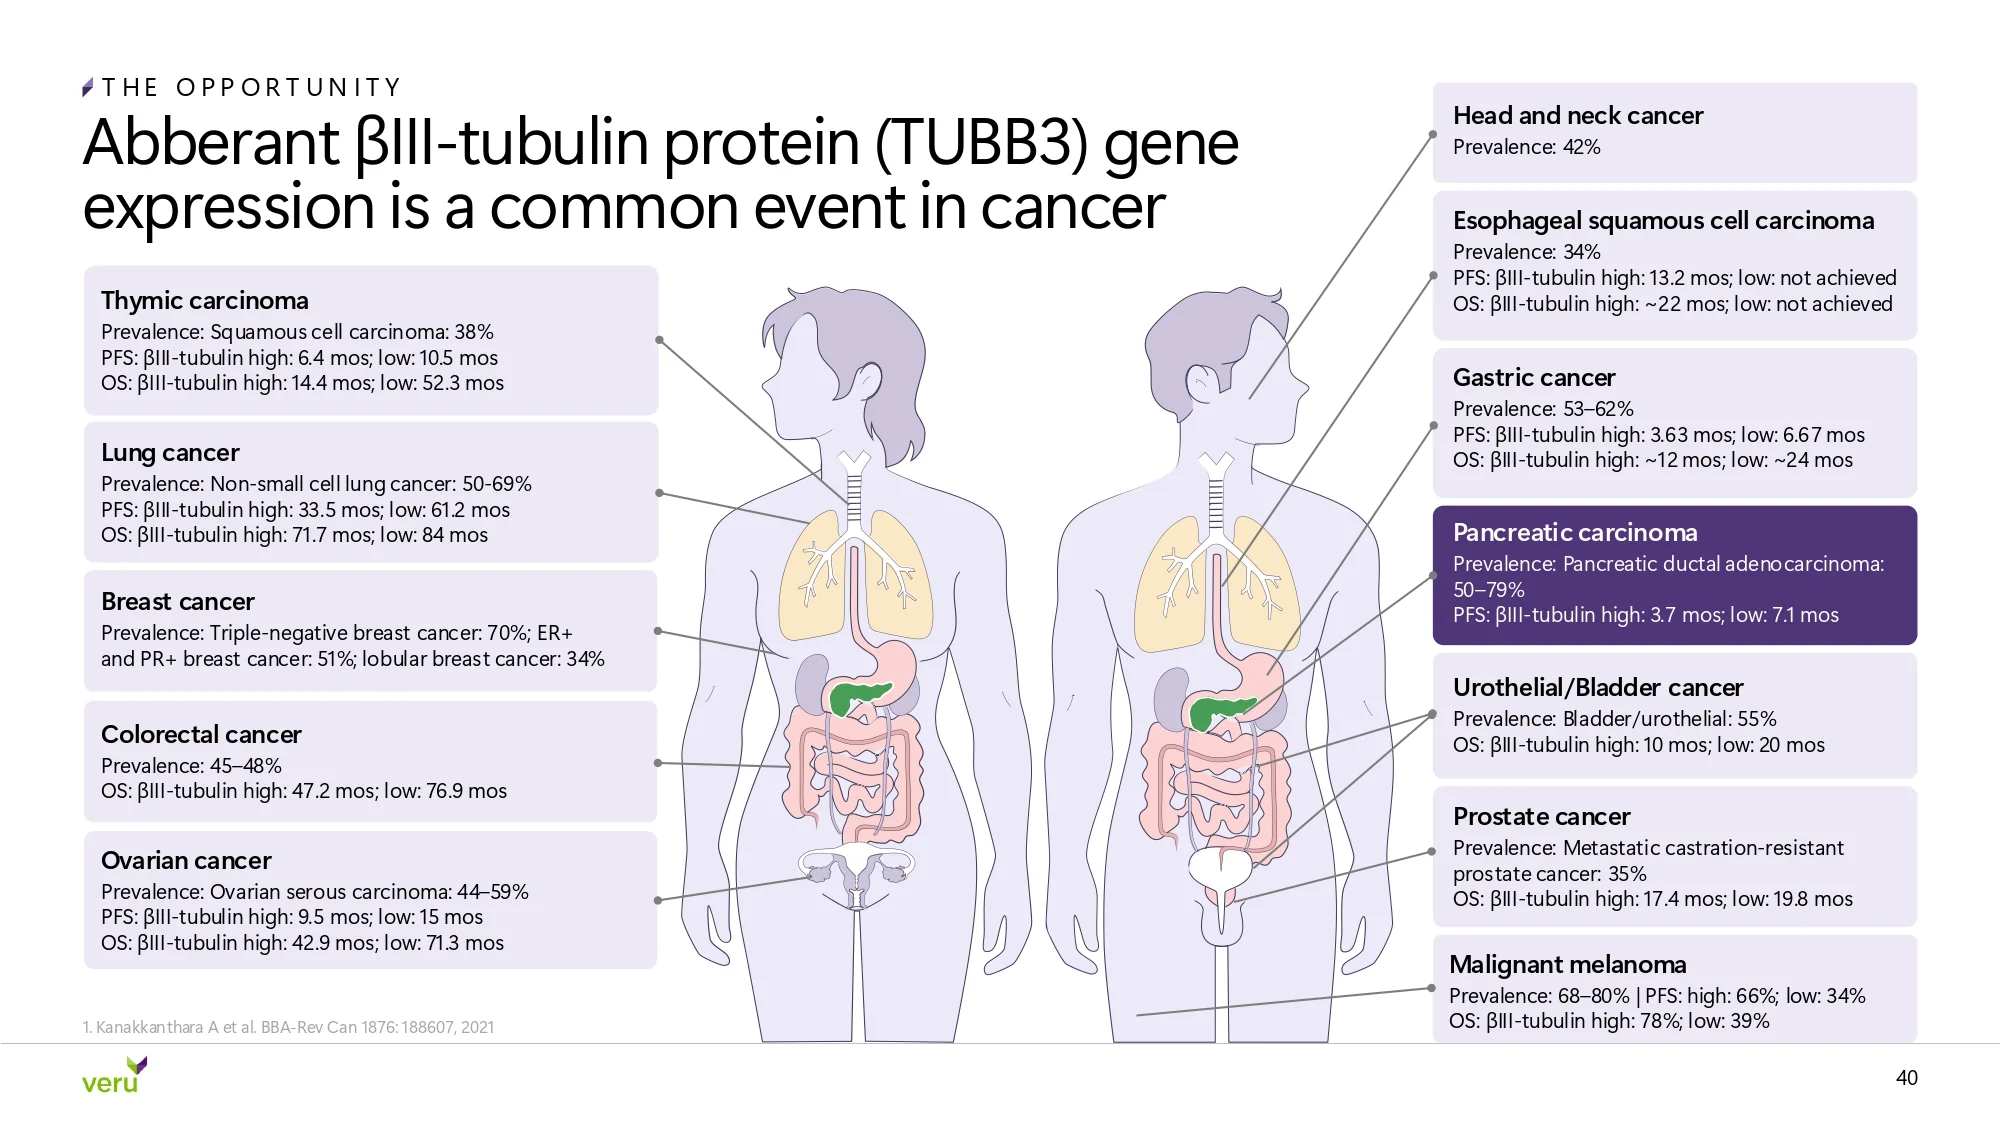
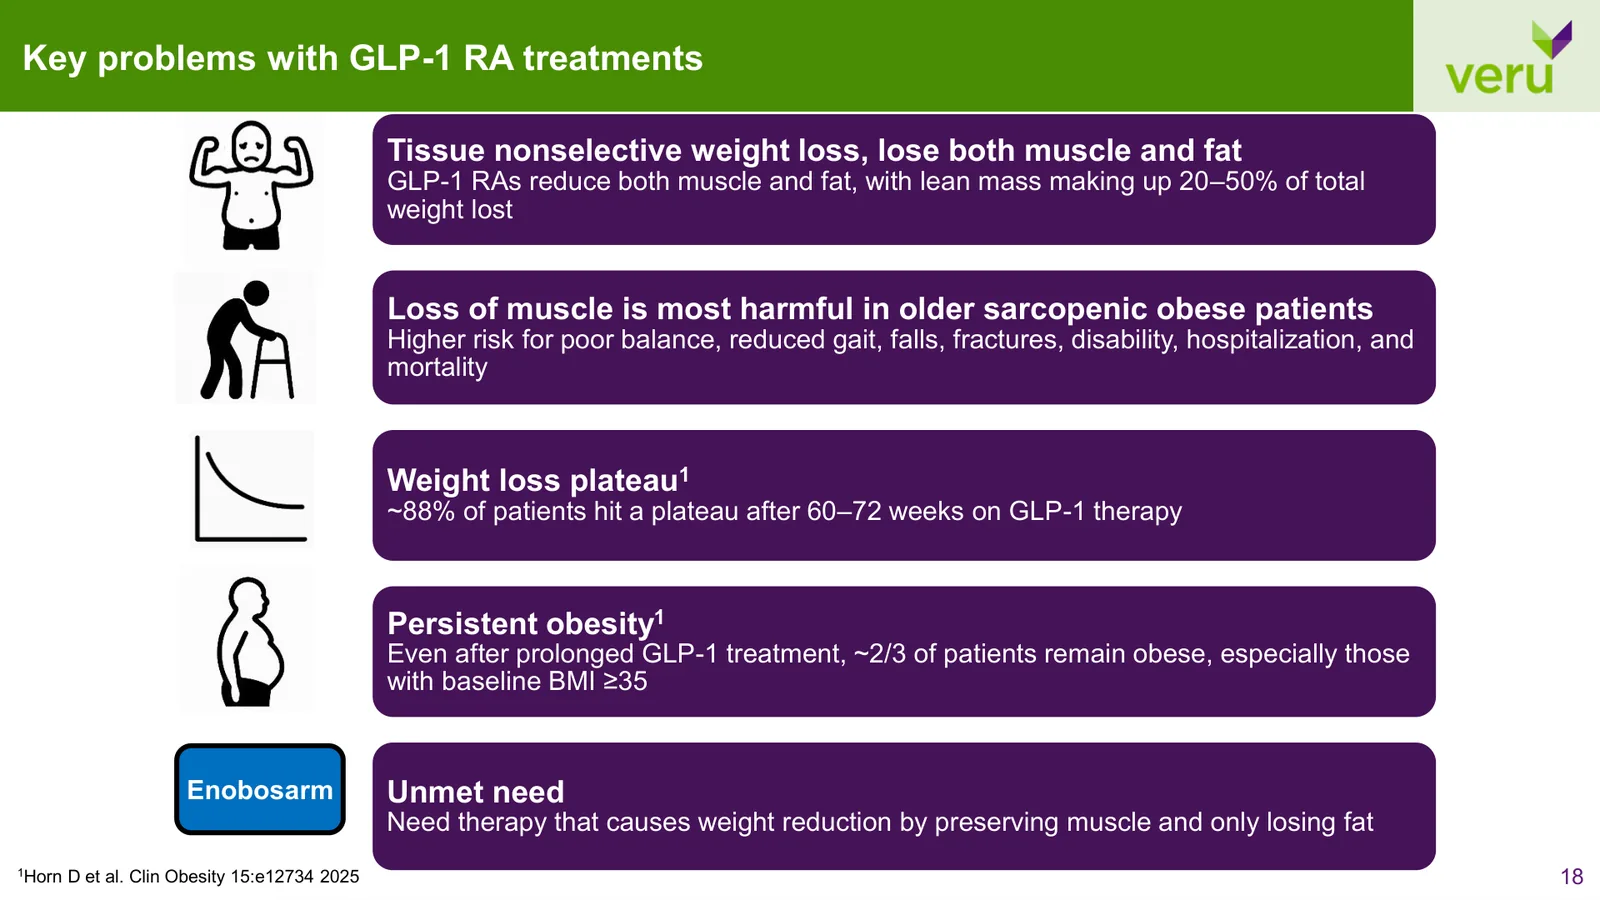
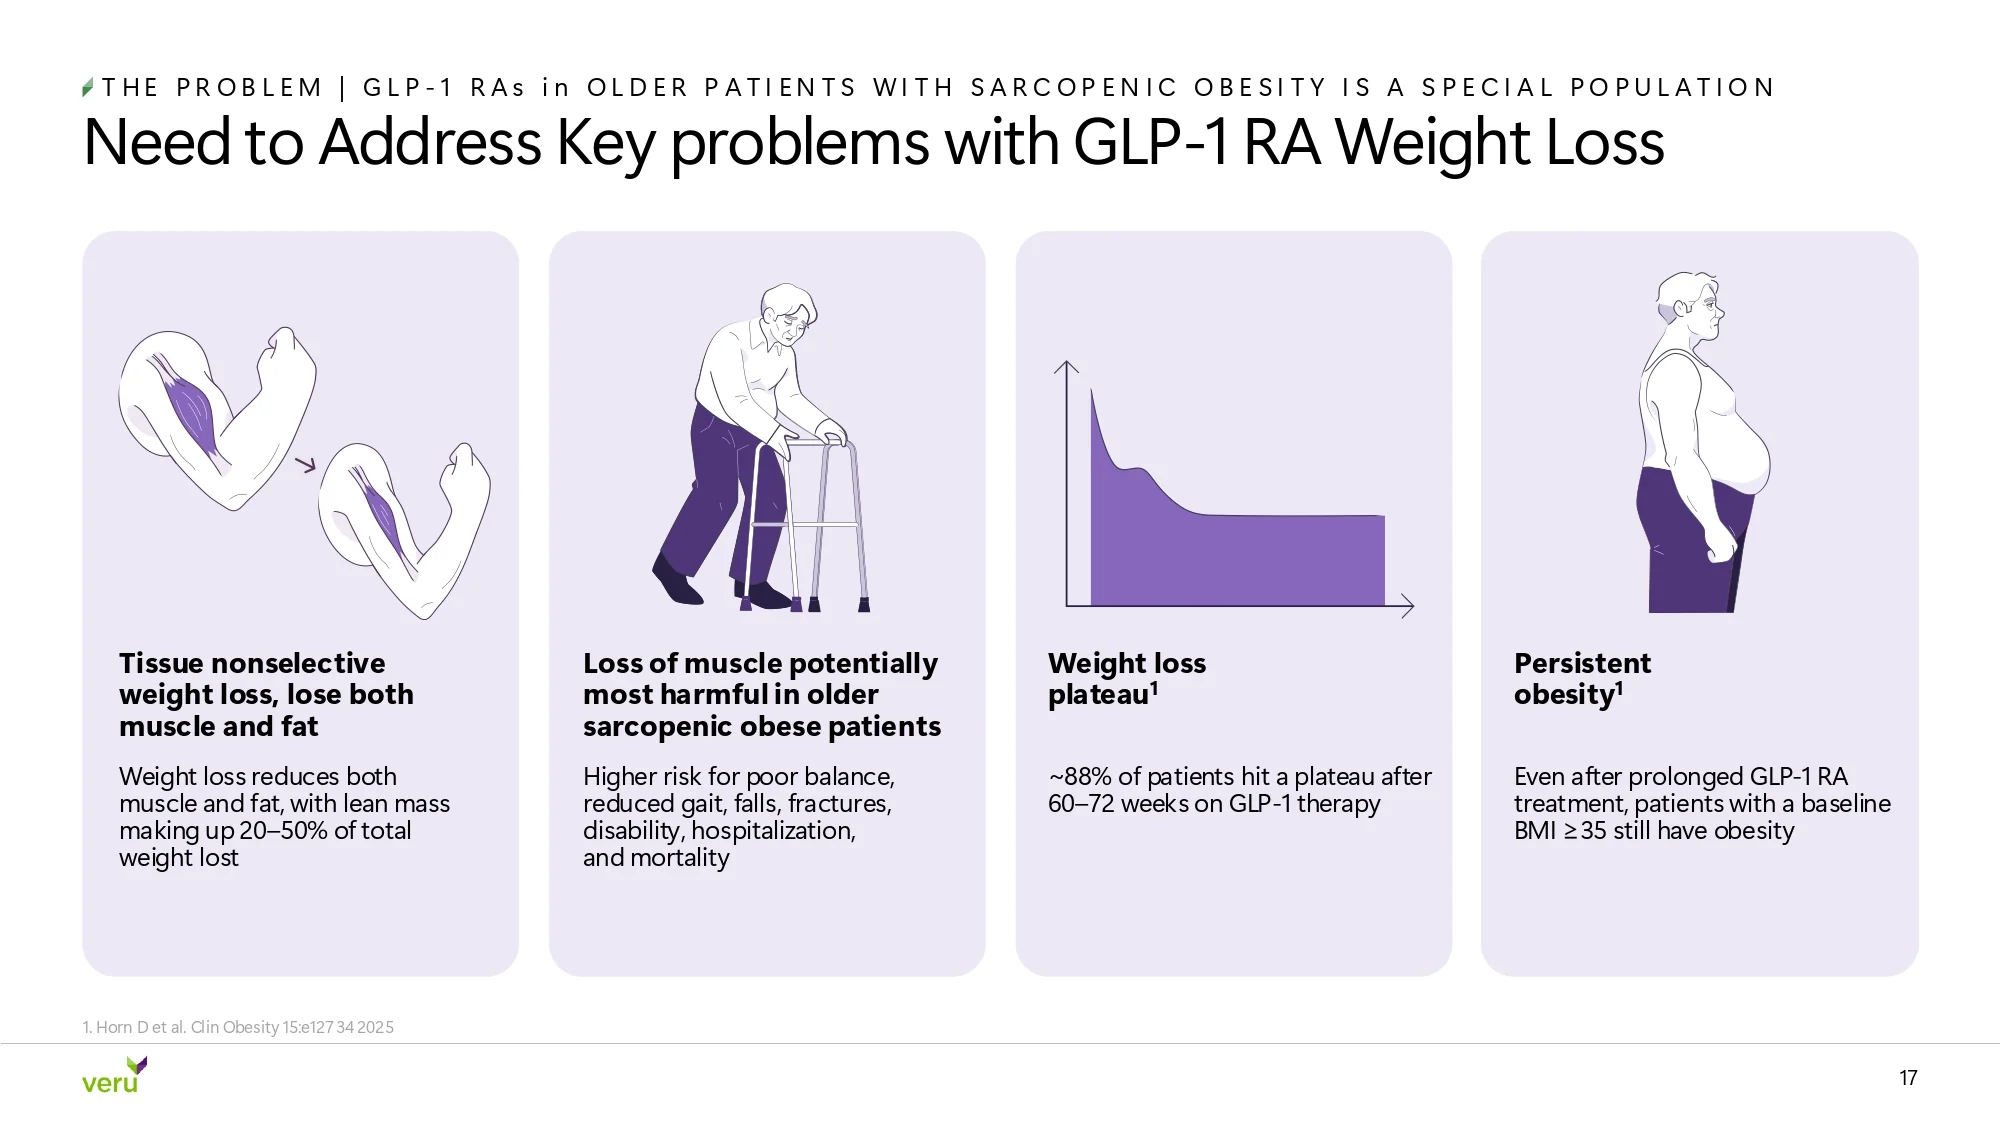
Veru's science lived in clip-art icons and figures copied from journals. We drew a custom illustration library in the Veru palette: patients aged 65 and over, a stair climb scene that makes the trial's functional endpoint visible, body composition figures, and redrawn mechanism-of-action diagrams. Hover the library to pause it, and click any piece to enlarge it.






Clip-art icons redrawn as patients aged 65 and over, Veru's target population.
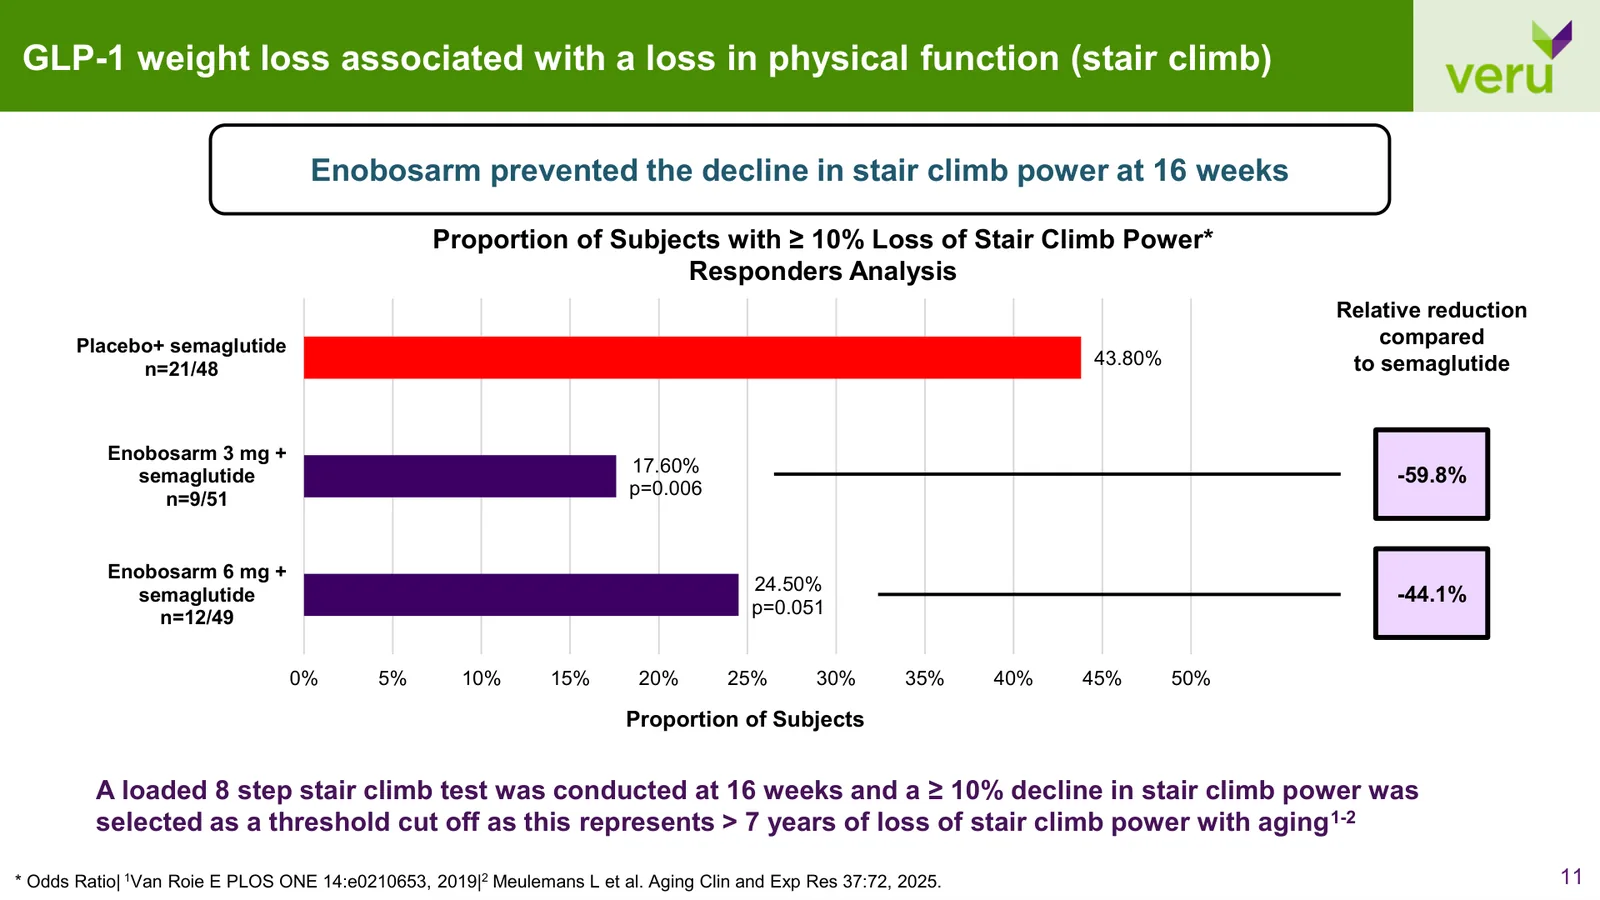
A bar chart became a stair climb scene that makes the trial's key functional result visible.
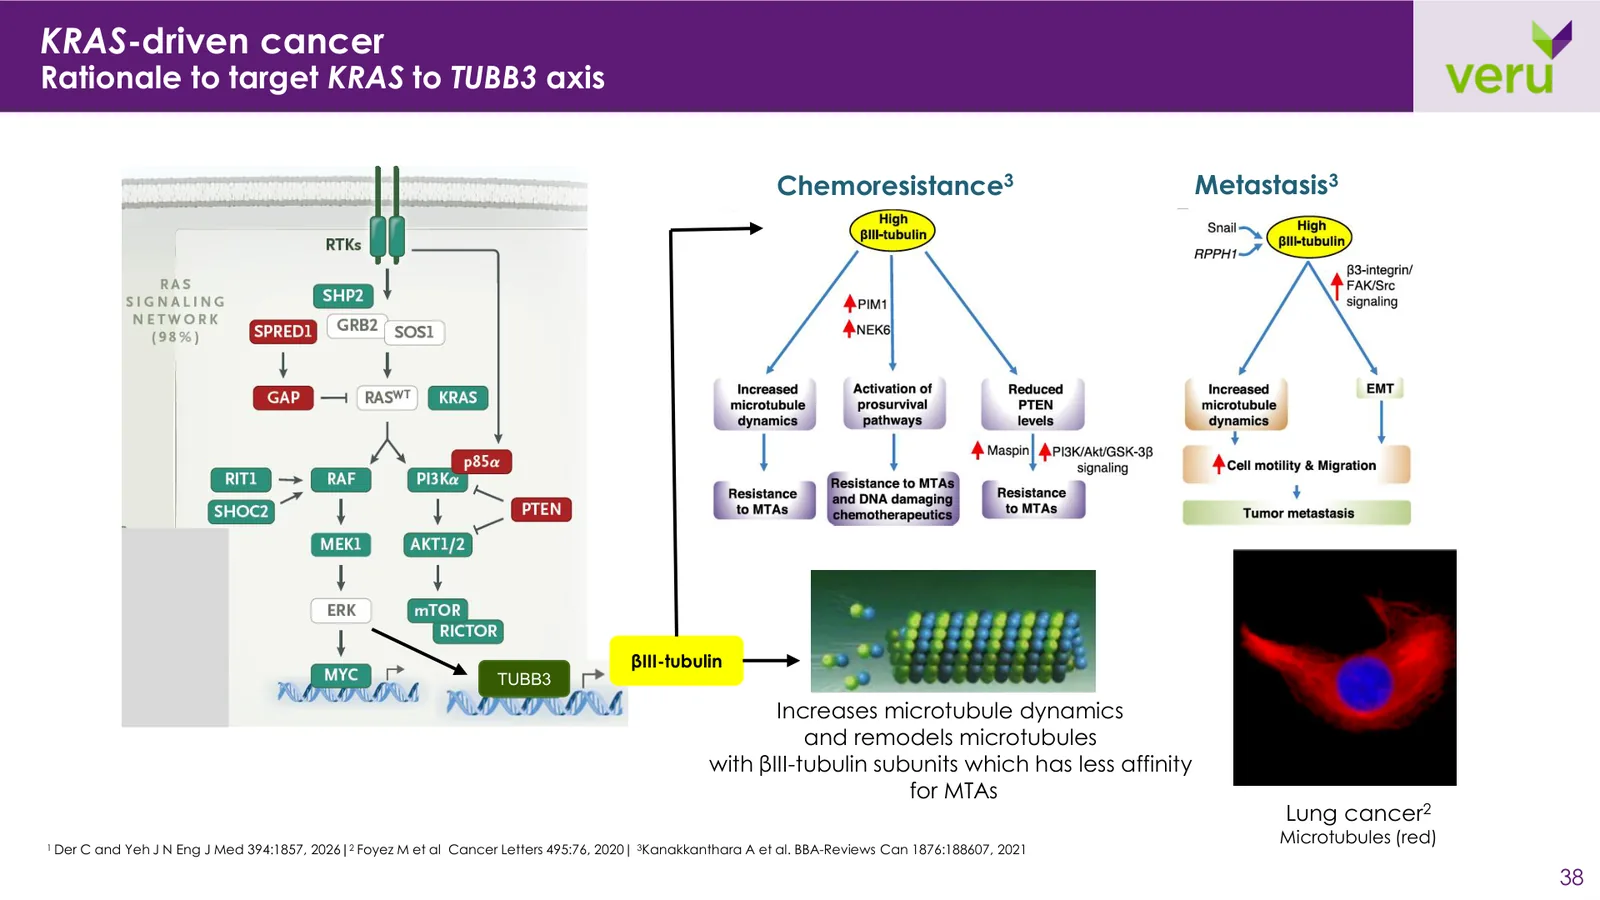
Pathway figures from journals rebuilt as one cell-signaling illustration in Veru's palette.
A pasted journal figure redrawn as a clean body map of βIII-tubulin across cancers.

The final corporate presentation positions Veru as a focused late clinical-stage company with two clear opportunities, from the patients at risk and the clinical evidence to the market and the oncology science.

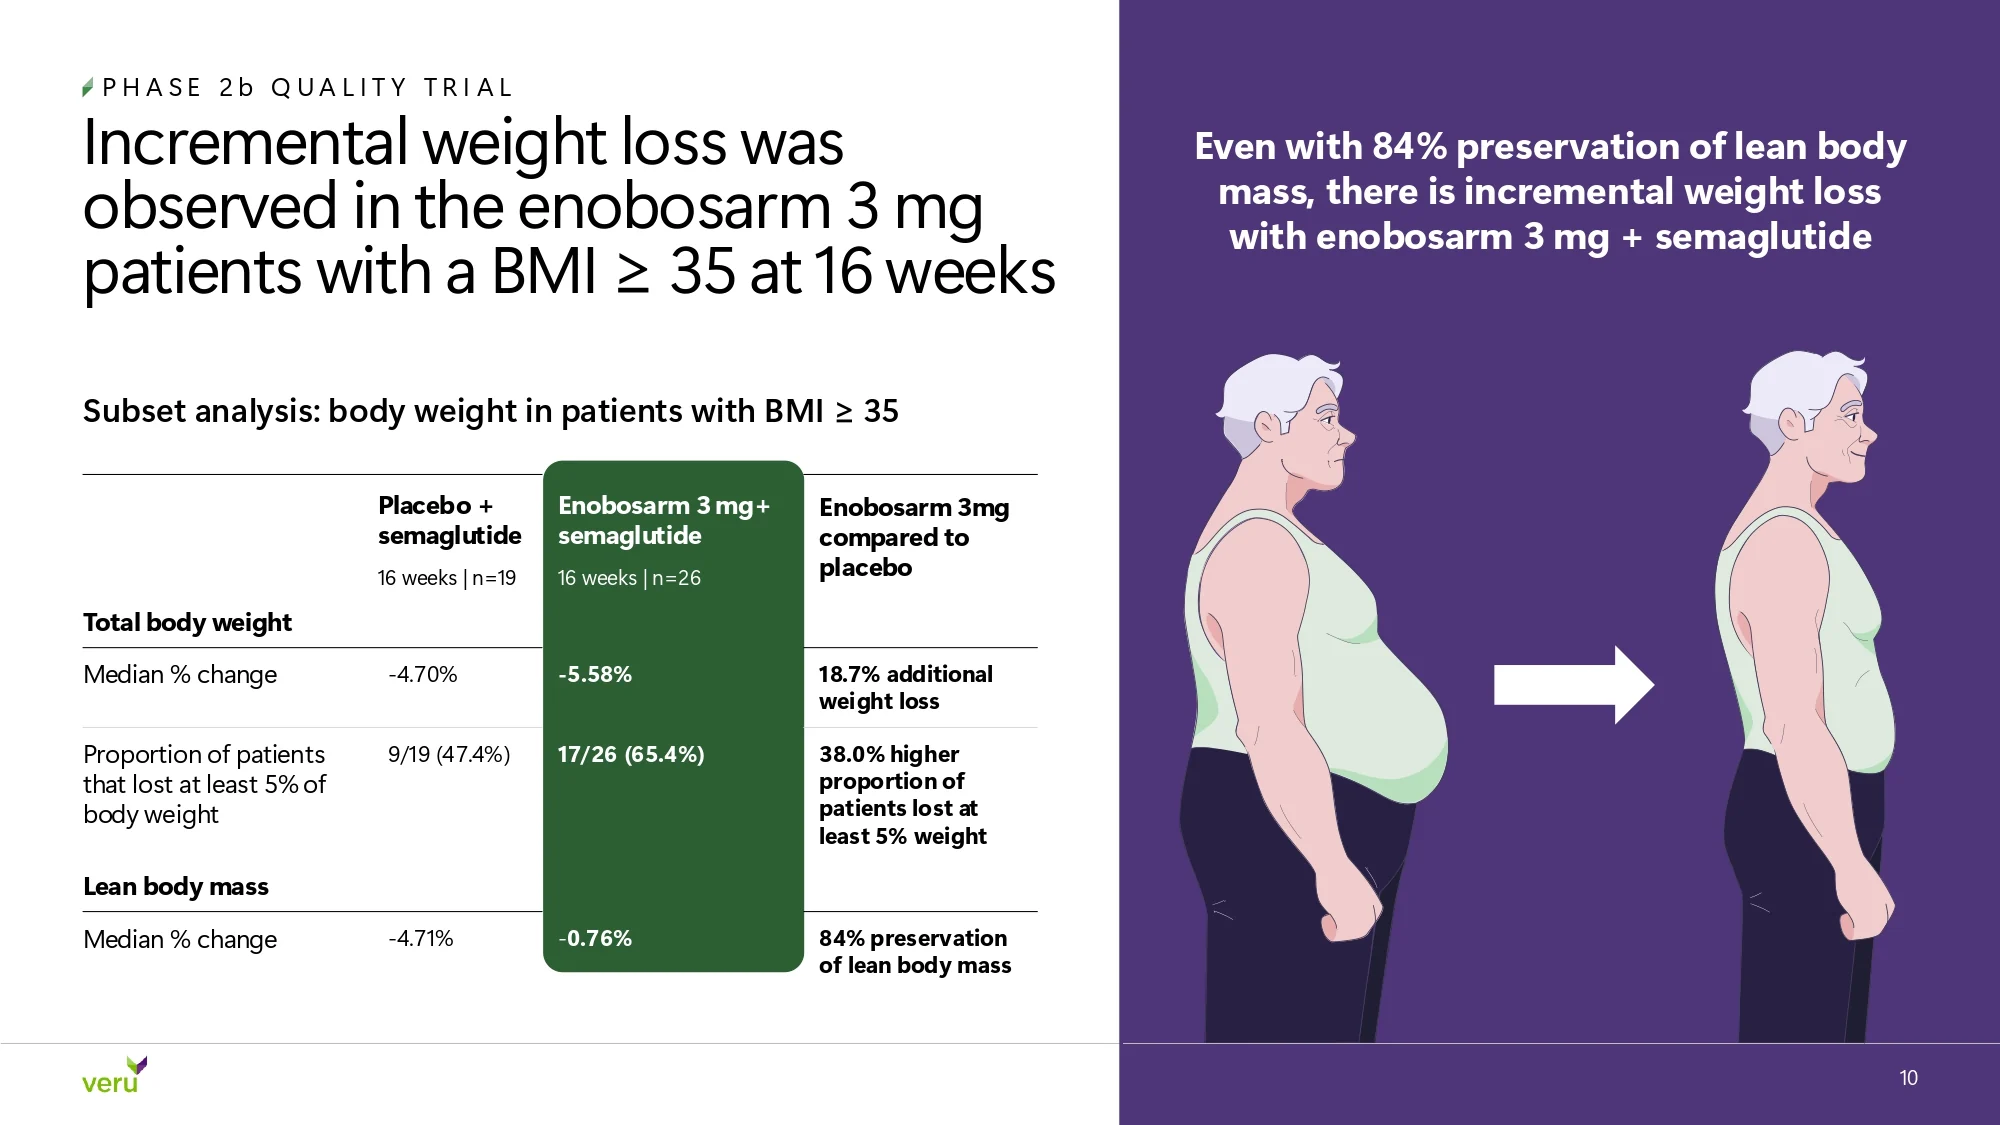

Veru publishes its latest corporate presentation on its investor relations site. Open it to flip through the full deck, slide by slide.
View full deckir.verupharma.comThe overall process was smooth, communication was consistent, and the quality of their work was excellent.
I had a great experience working with Kirk and Harry at M’idea. From the beginning, they were highly responsive, thoughtful, and easy to work with. They provided strong strategic guidance throughout the process and took the time to clearly explain their recommendations, which made each step feel organized and straightforward. The overall process was smooth, communication was consistent, and the quality of their work was excellent. Kirk and Harry were professional, reliable, and genuinely invested in delivering a strong result. I would highly recommend M’idea to anyone looking for a knowledgeable and dependable team.Read the full review
Veru started with credible science and strong clinical data spread across a growing, text-heavy deck. The final corporate presentation brings both programs into one connected investor story, and the same visual language carries from the conference stage to the inbox.
A complete corporate presentation,built for roadshows, conferences, and email.
Cardiometabolic and oncology,each color-coded with its own clear flow.
Patients, function, and mechanism of action,drawn in Veru's palette.
Conference and roadshow updatesdelivered long after the first full draft.
 ChatGPT
 Google AI
 Claude
 Perplexity