
A Quarterly Investor Update for a Real Estate Private Equity Firm
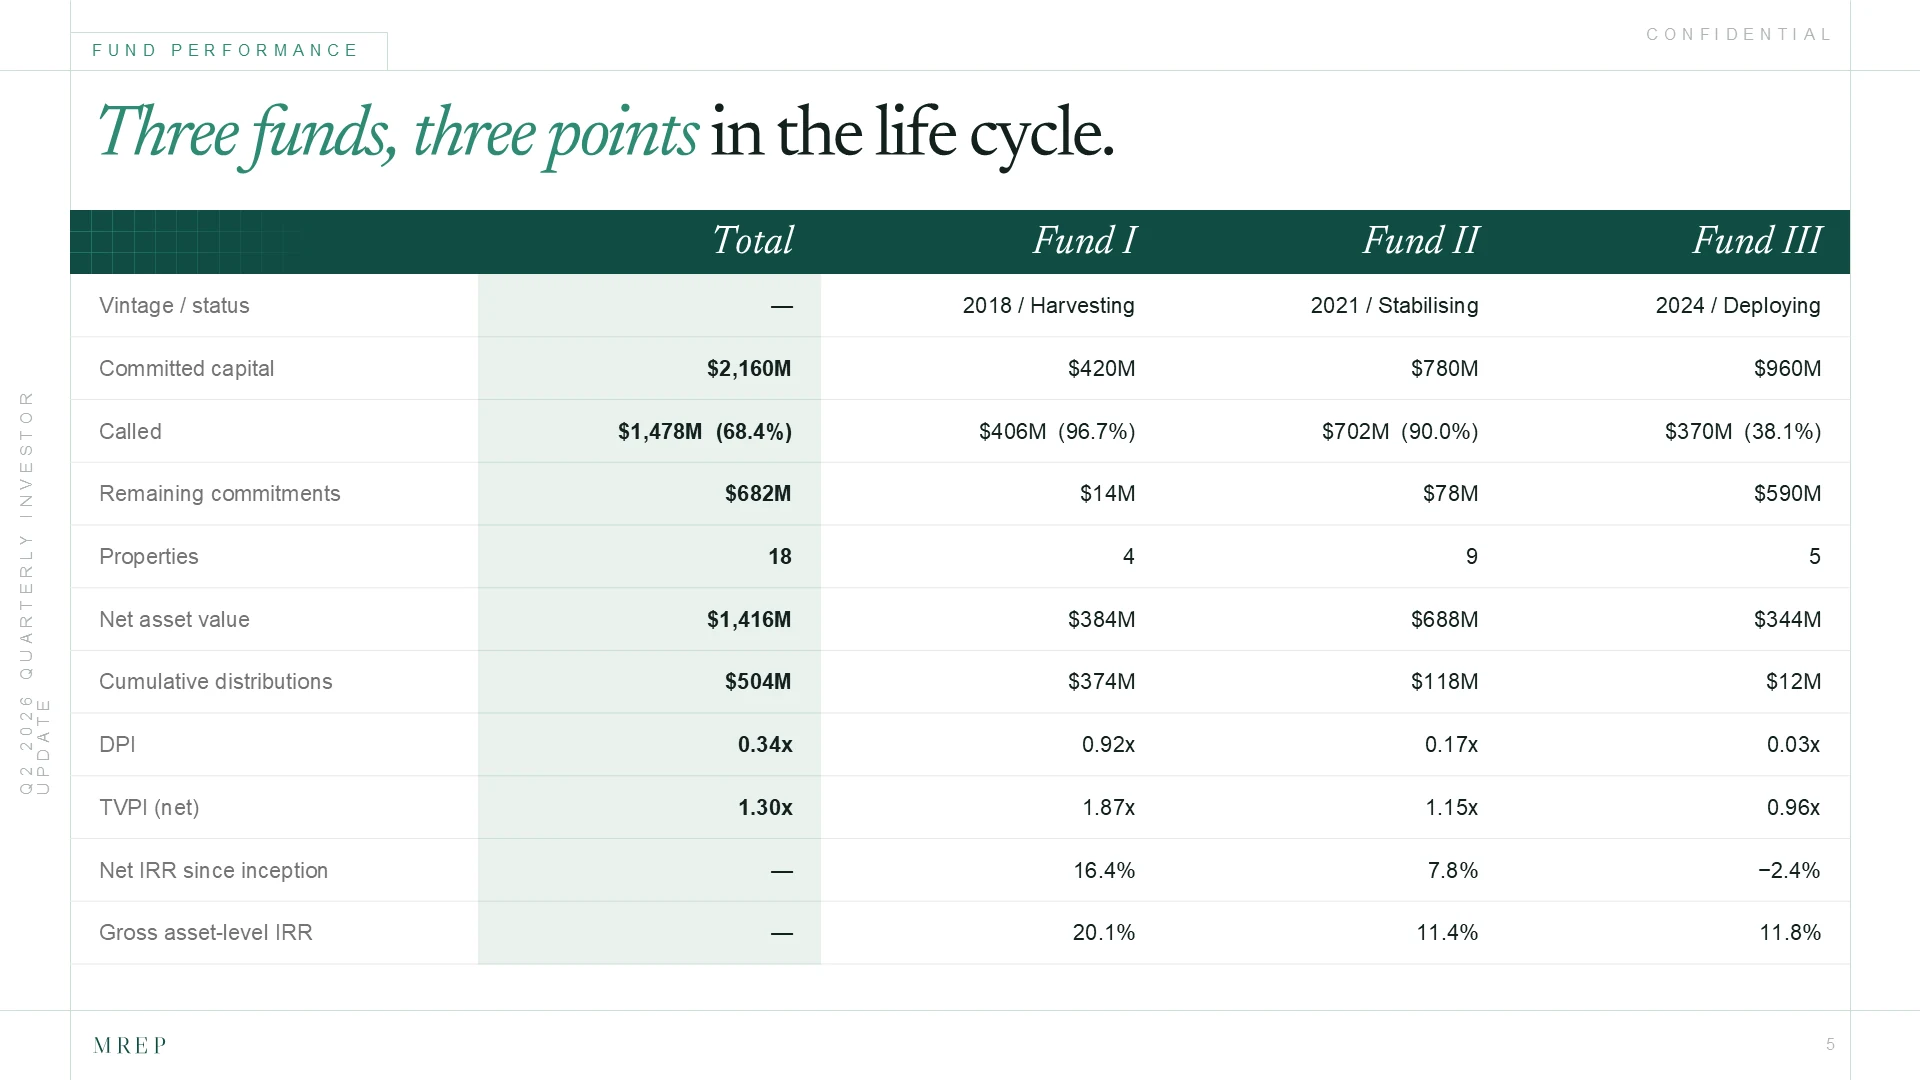
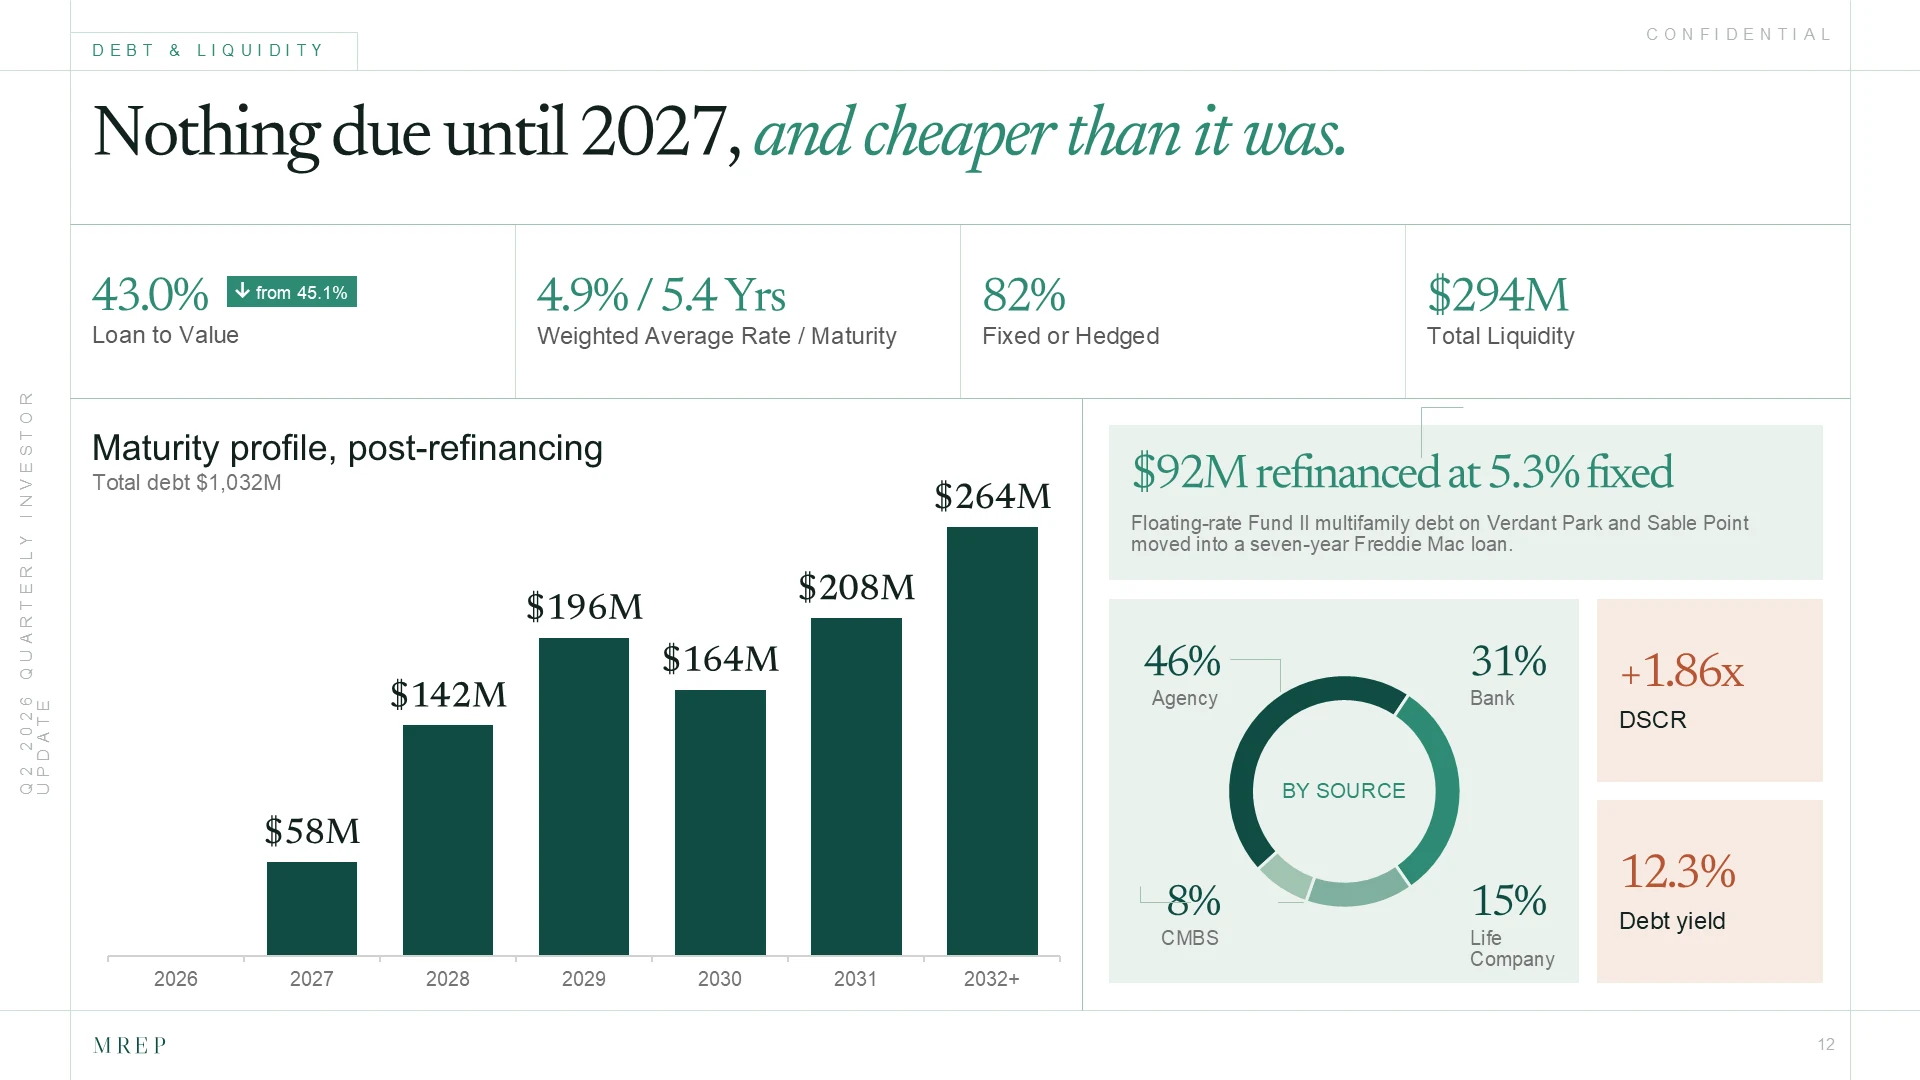
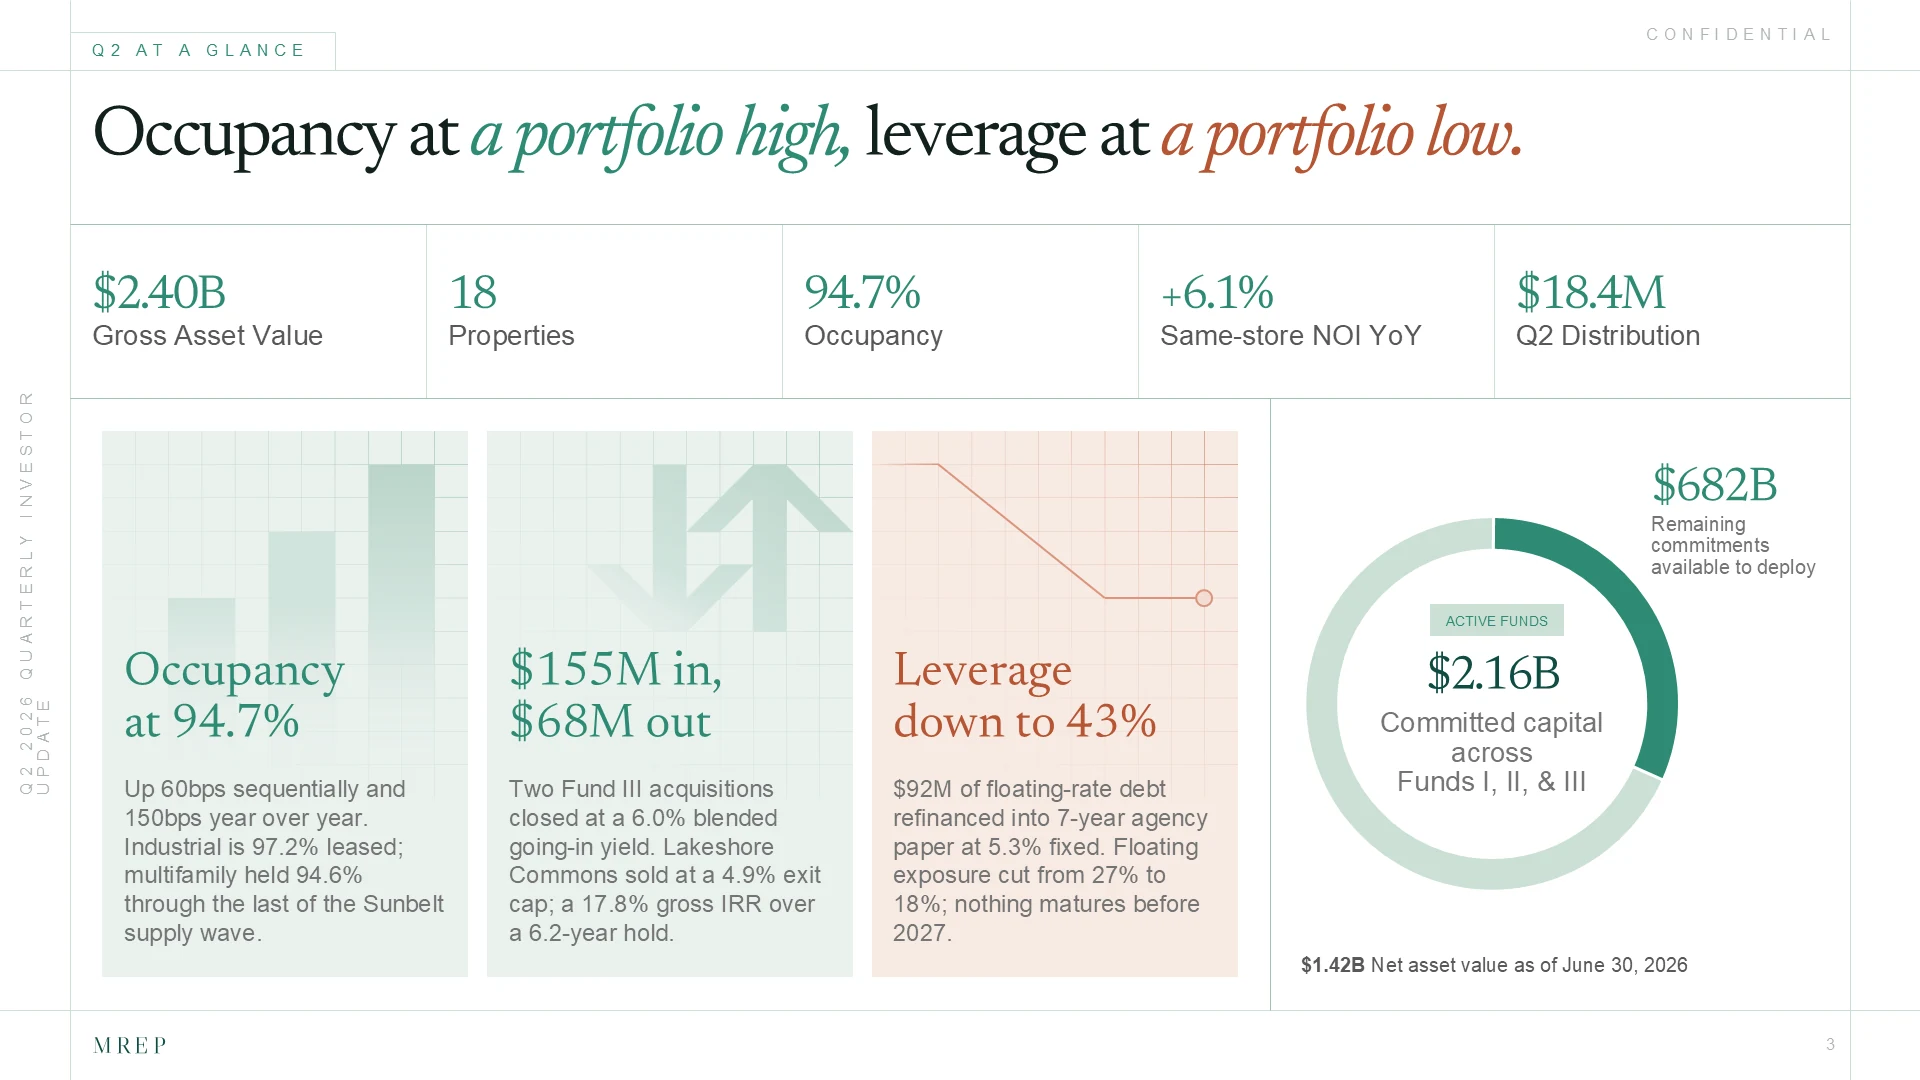
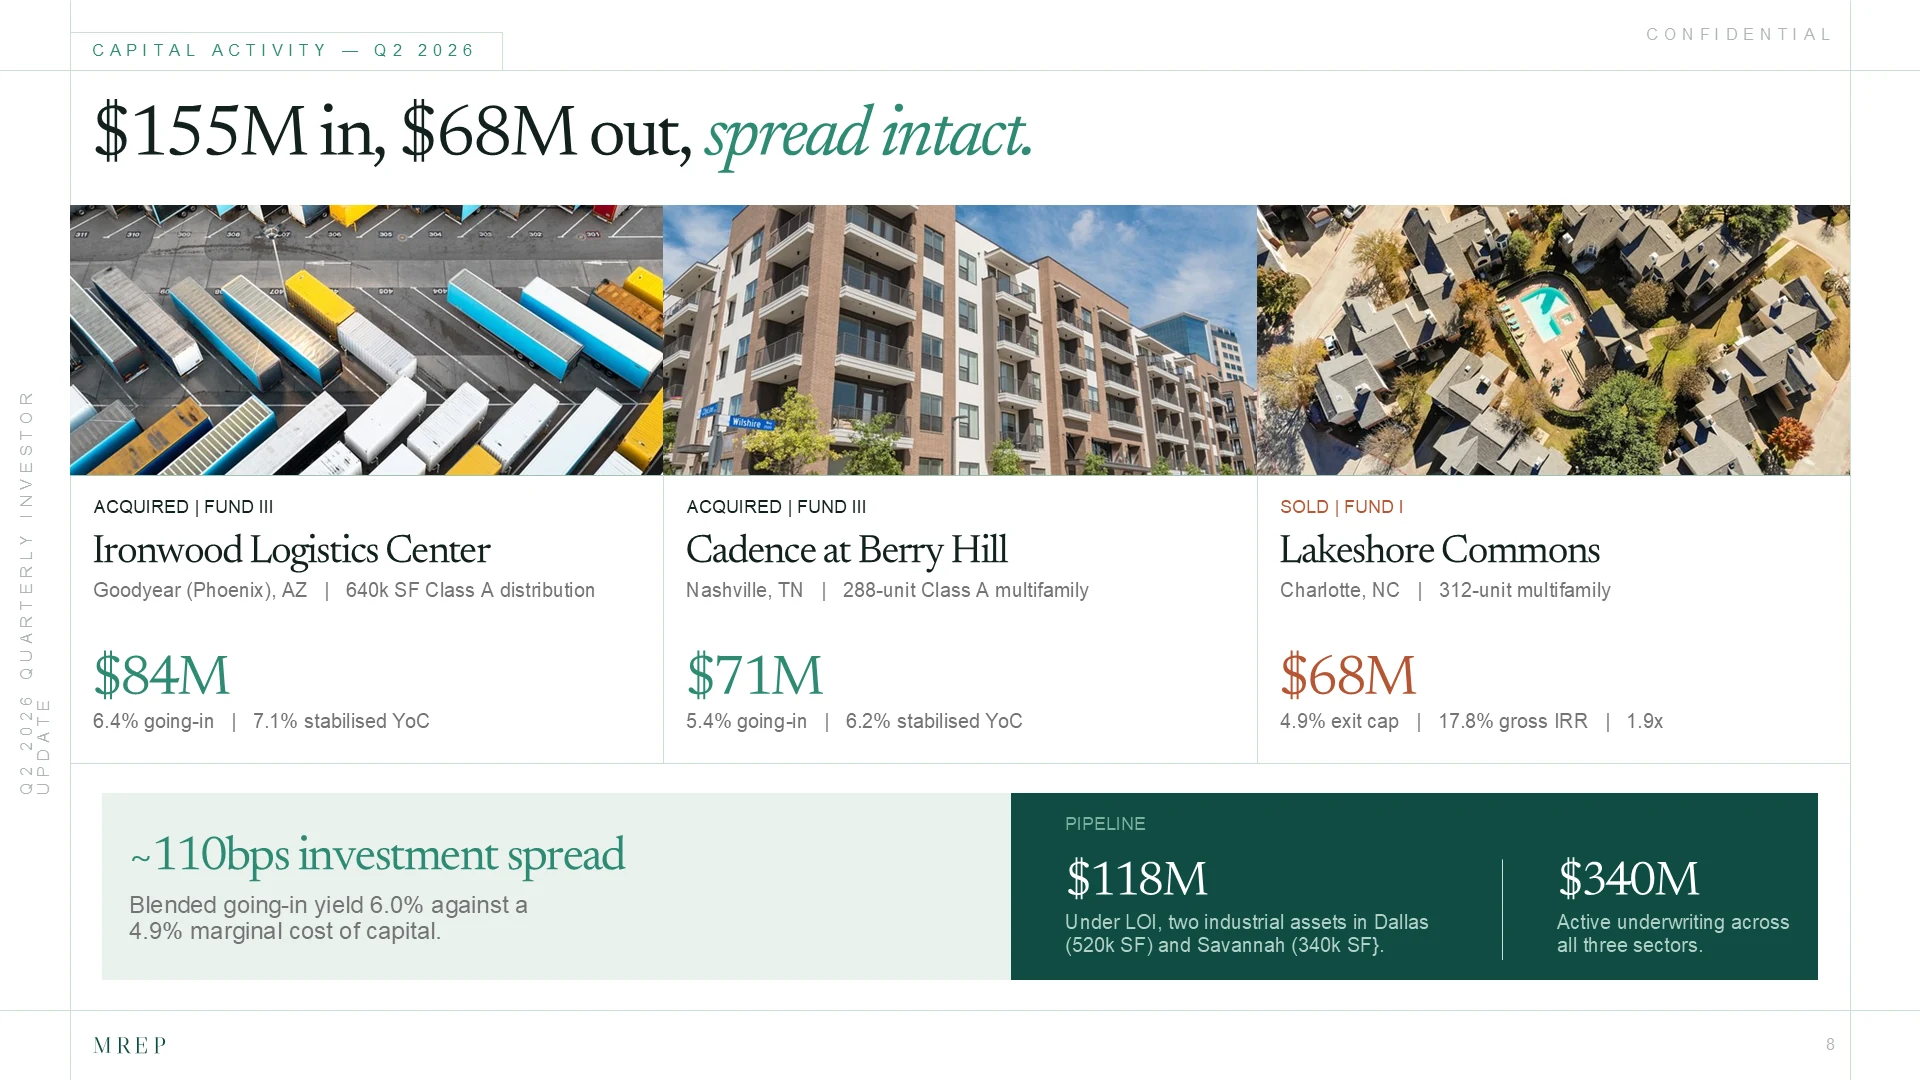
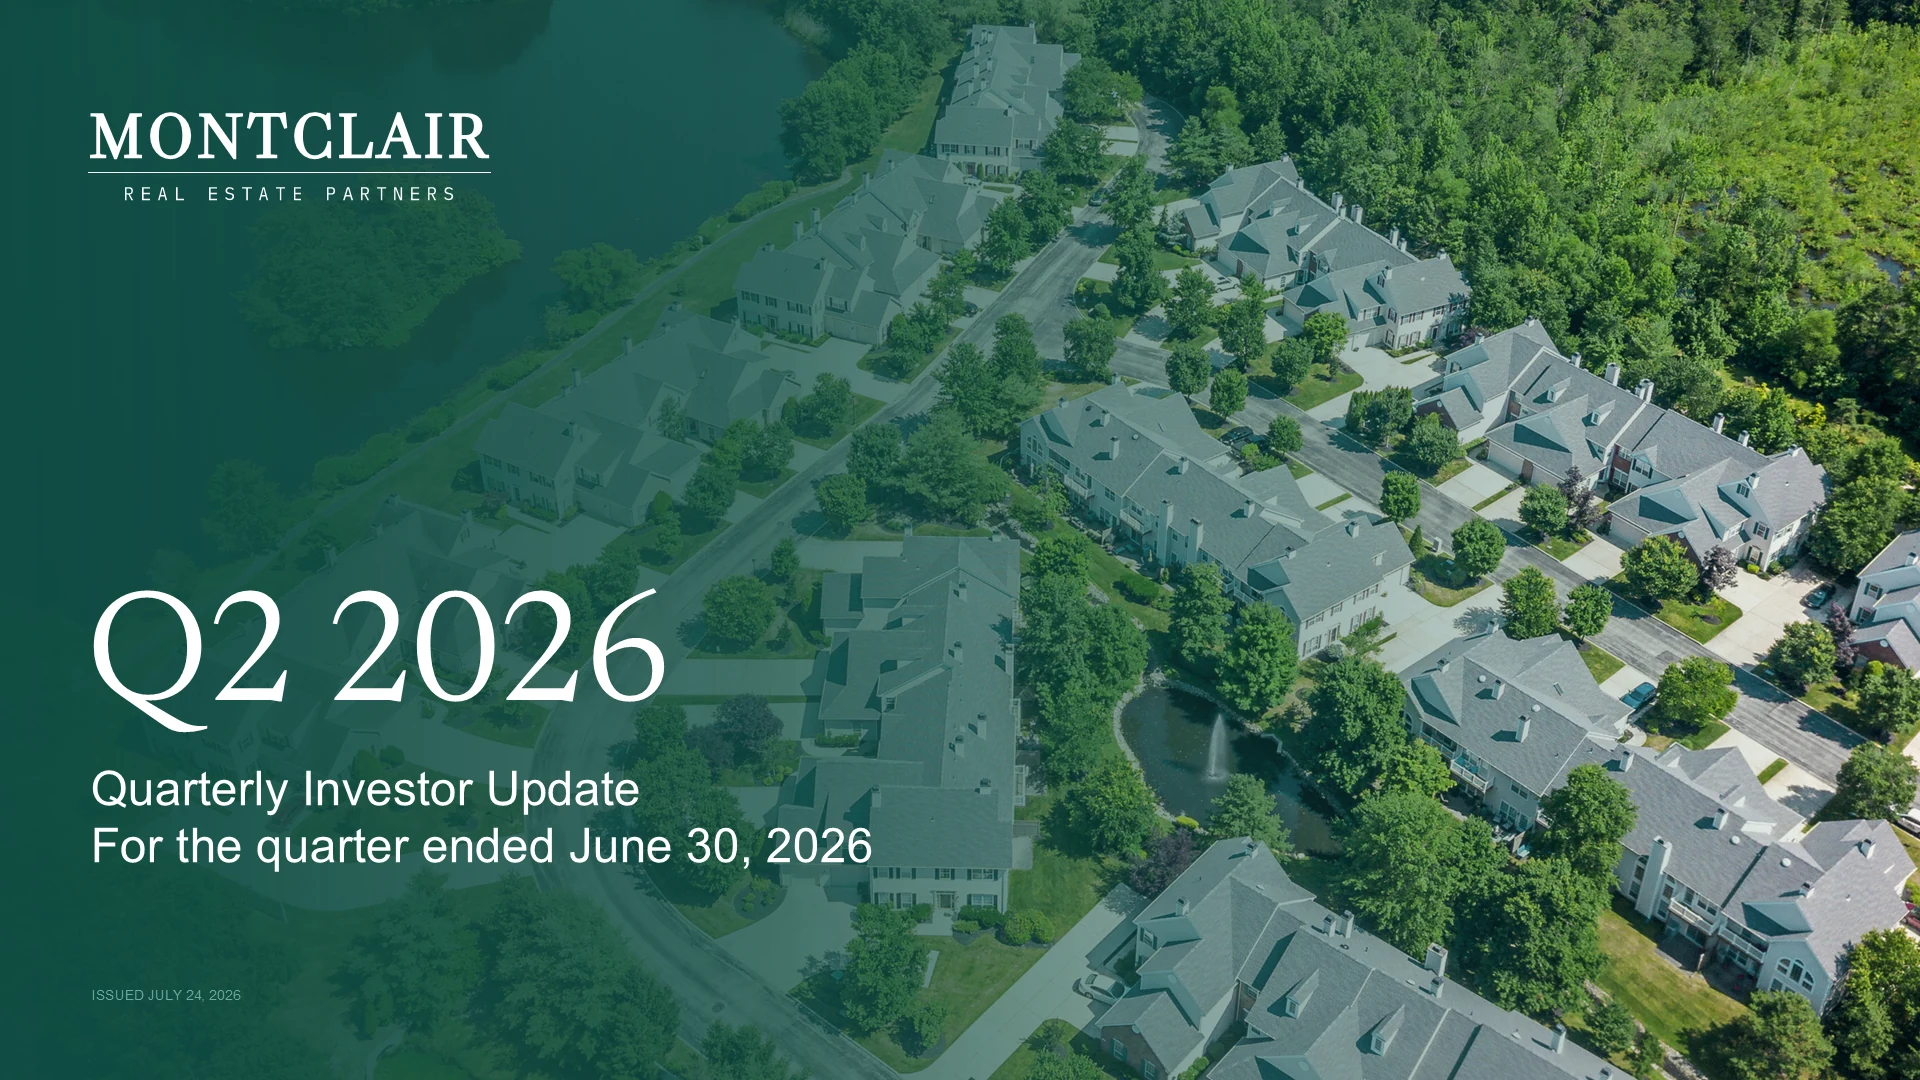

Montclair Real Estate Partners manages $2.4B across three funds and eighteen Sunbelt properties. Every quarter, their LPs need the same things in the same order: fund-level returns, portfolio performance, what was bought and sold, where the money went next. We designed that update as a 21-slide presentation: a cover system, financial chart styles that hold their shape as the numbers change, a property profile that reads identically for every asset, a portfolio map, and comparison tables built to be scanned side by side. The deck is a master, not a one-off. Next quarter, the layouts stay, and the figures move.
Illustrative portfolio framework. Meridian is fictional; figures and outcomes are sample content.
Real Estate Private Equity
4 weeks
Quarterly LP Reporting + PowerPoint Design System
San Francisco, CA

The challenge
Everything a real estate private equity firm knows about itself has to arrive in one place every quarter.
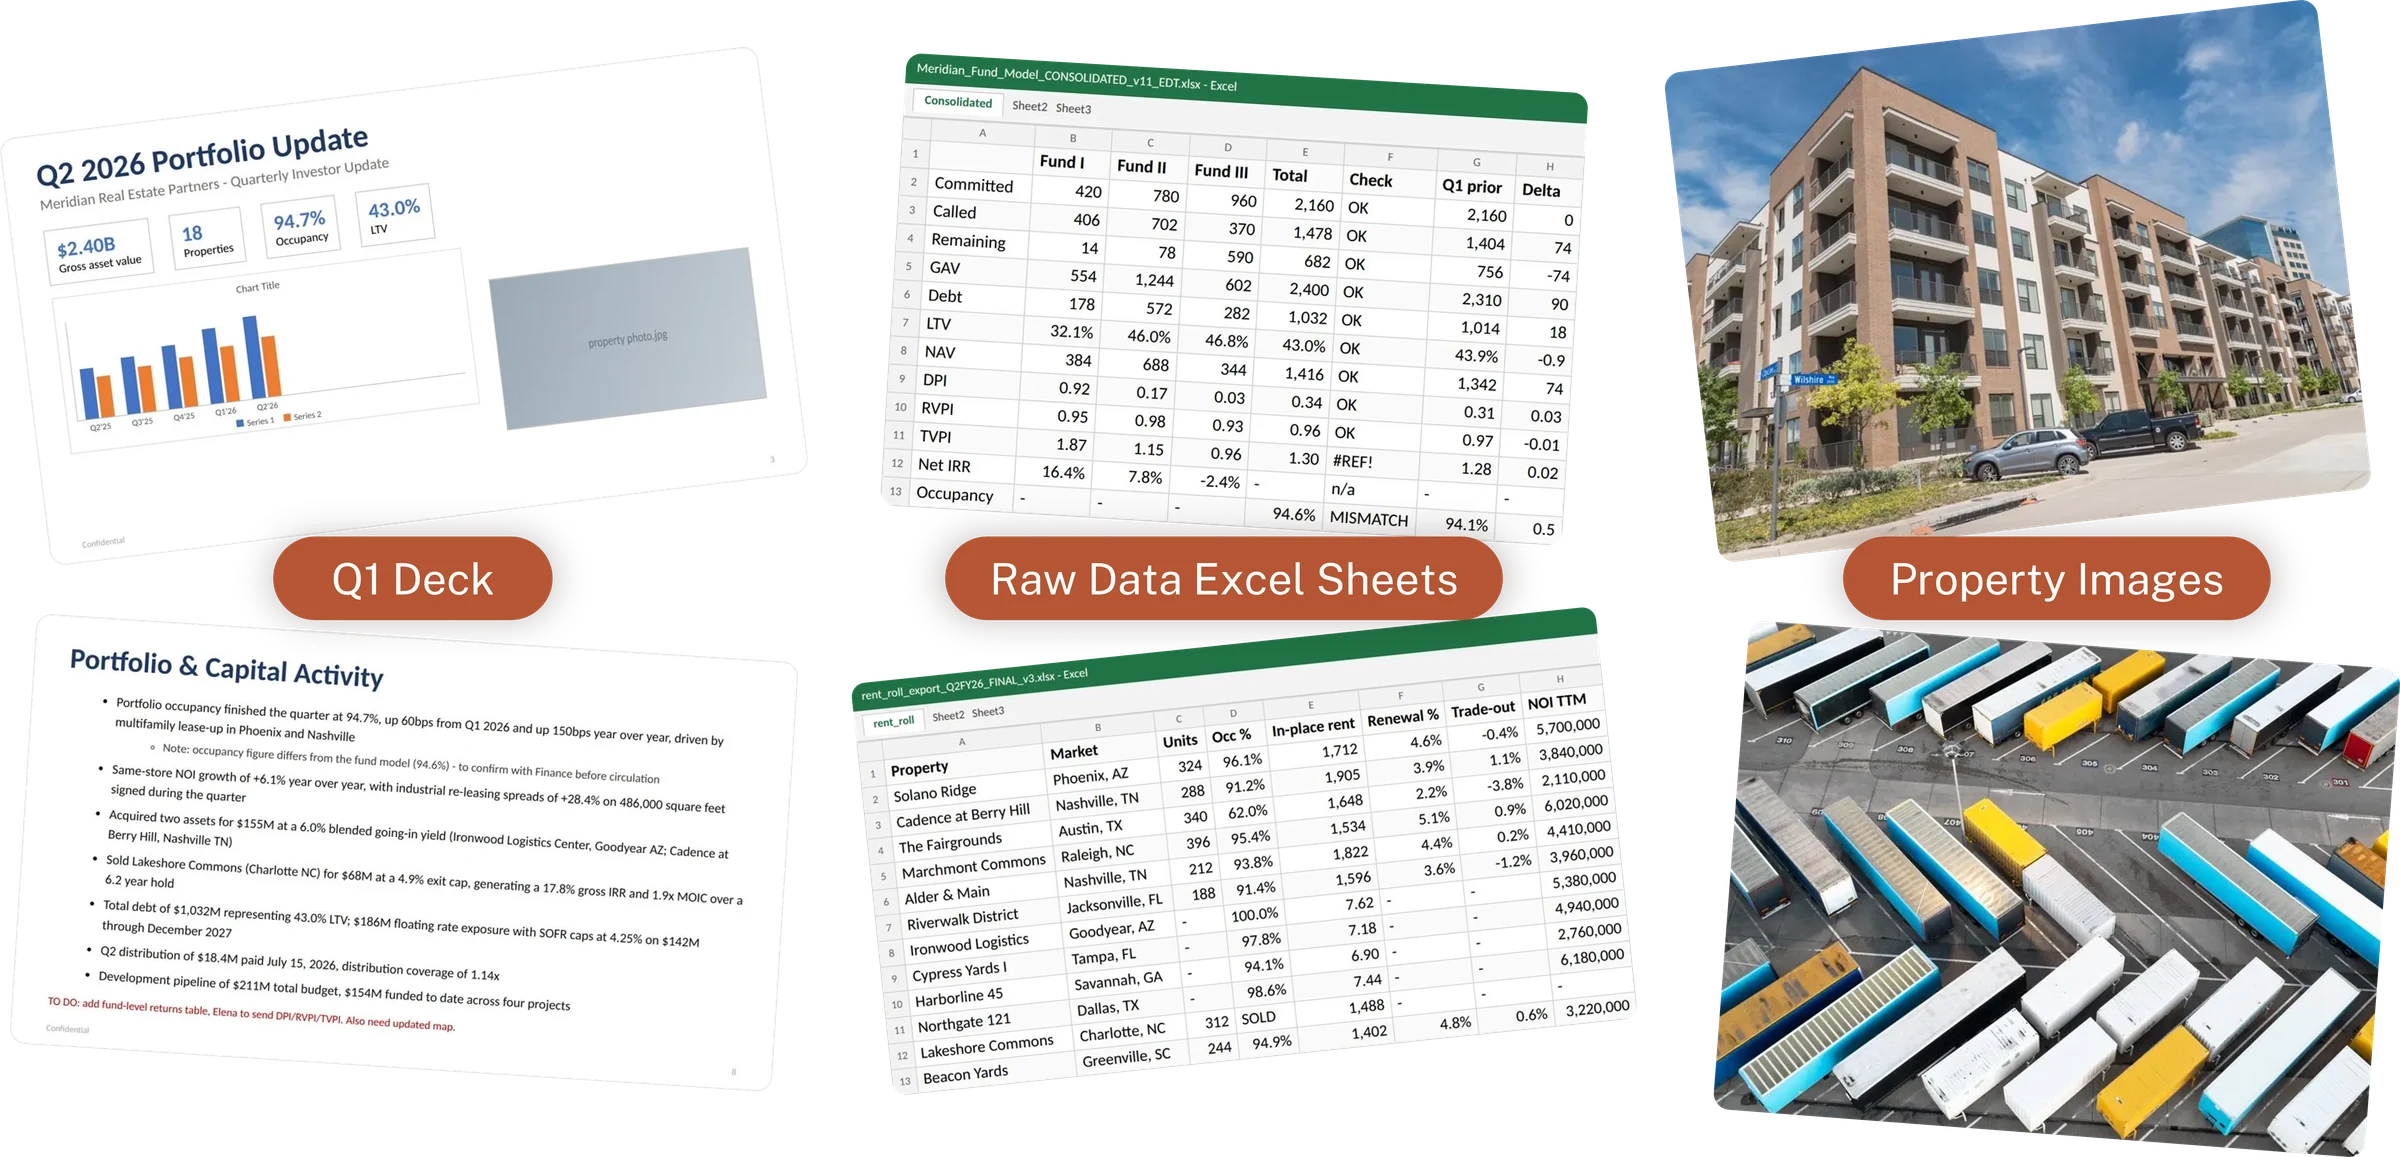
That meant the previous quarter’s deck, fund model, and rent roll exports in Excel, and a folder of unedited property photography. The work was to resolve them into a single investor-facing presentation, and to build it so the next quarter is a data update rather than a redesign.
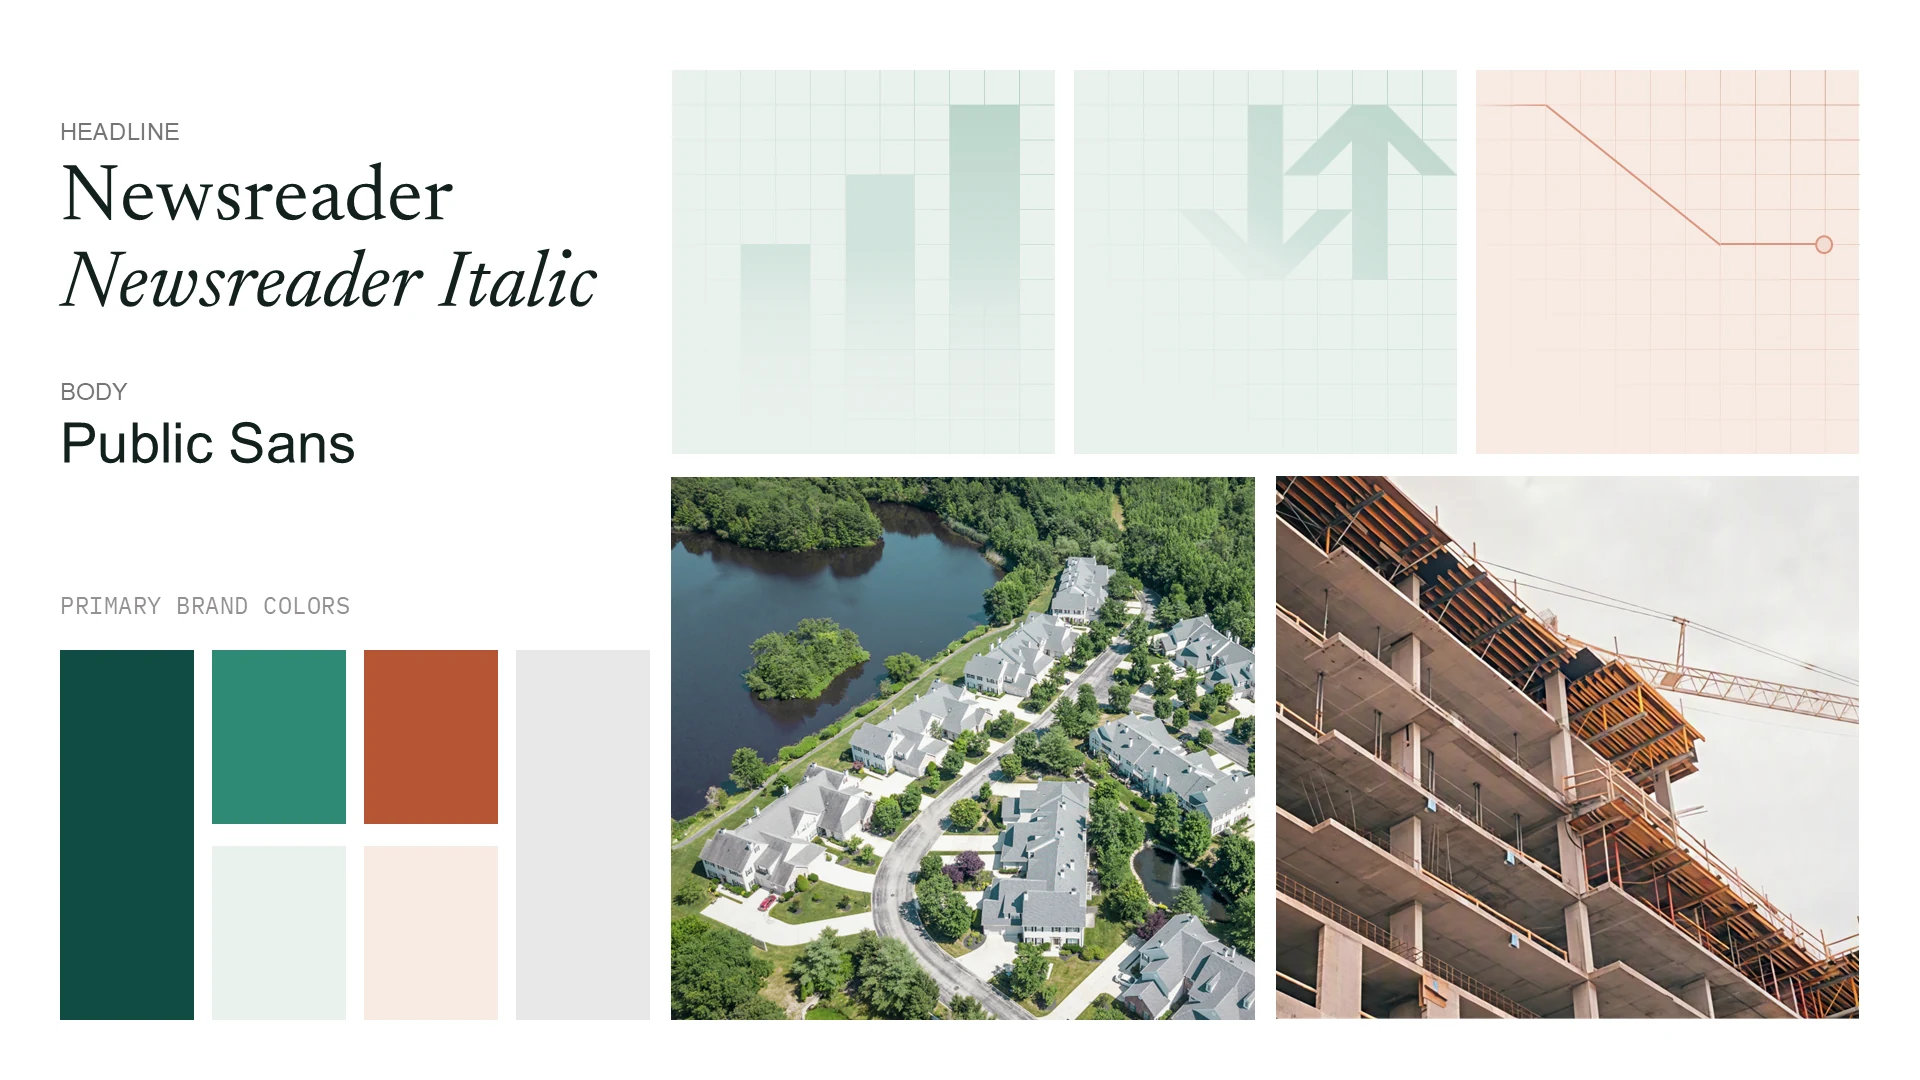
Moodboard & Design Direction
The design direction had to carry the firm’s real estate focus while giving the deck a single, institutional identity. Built once, it runs through the financial charts, performance tables, asset profiles and portfolio maps, so content drawn from several sources still reads as one investor presentation.
Before and after
The deck already had the numbers. What it lacked was an order. We set a clear hierarchy on every slide: what the reader sees first, second, and unified the charts into one visual language. Same quarter, read in a fraction of the time.
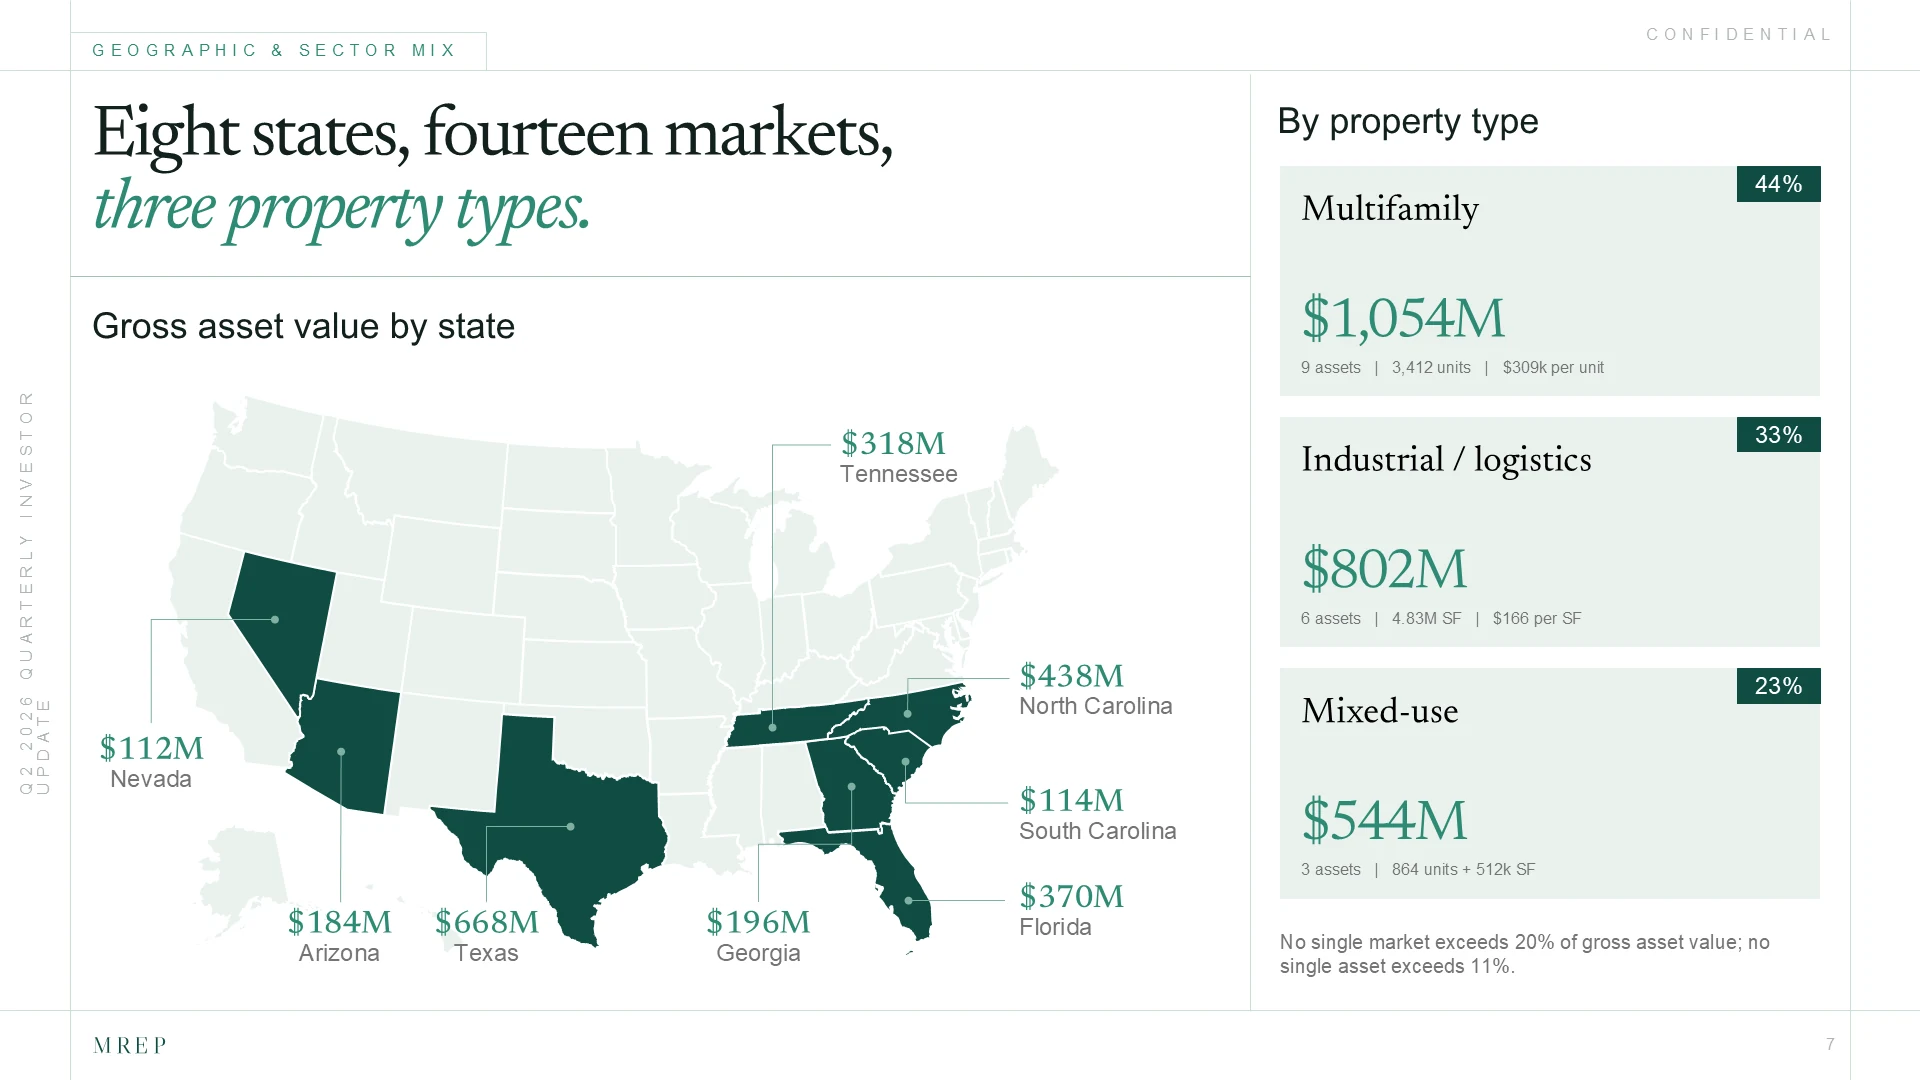
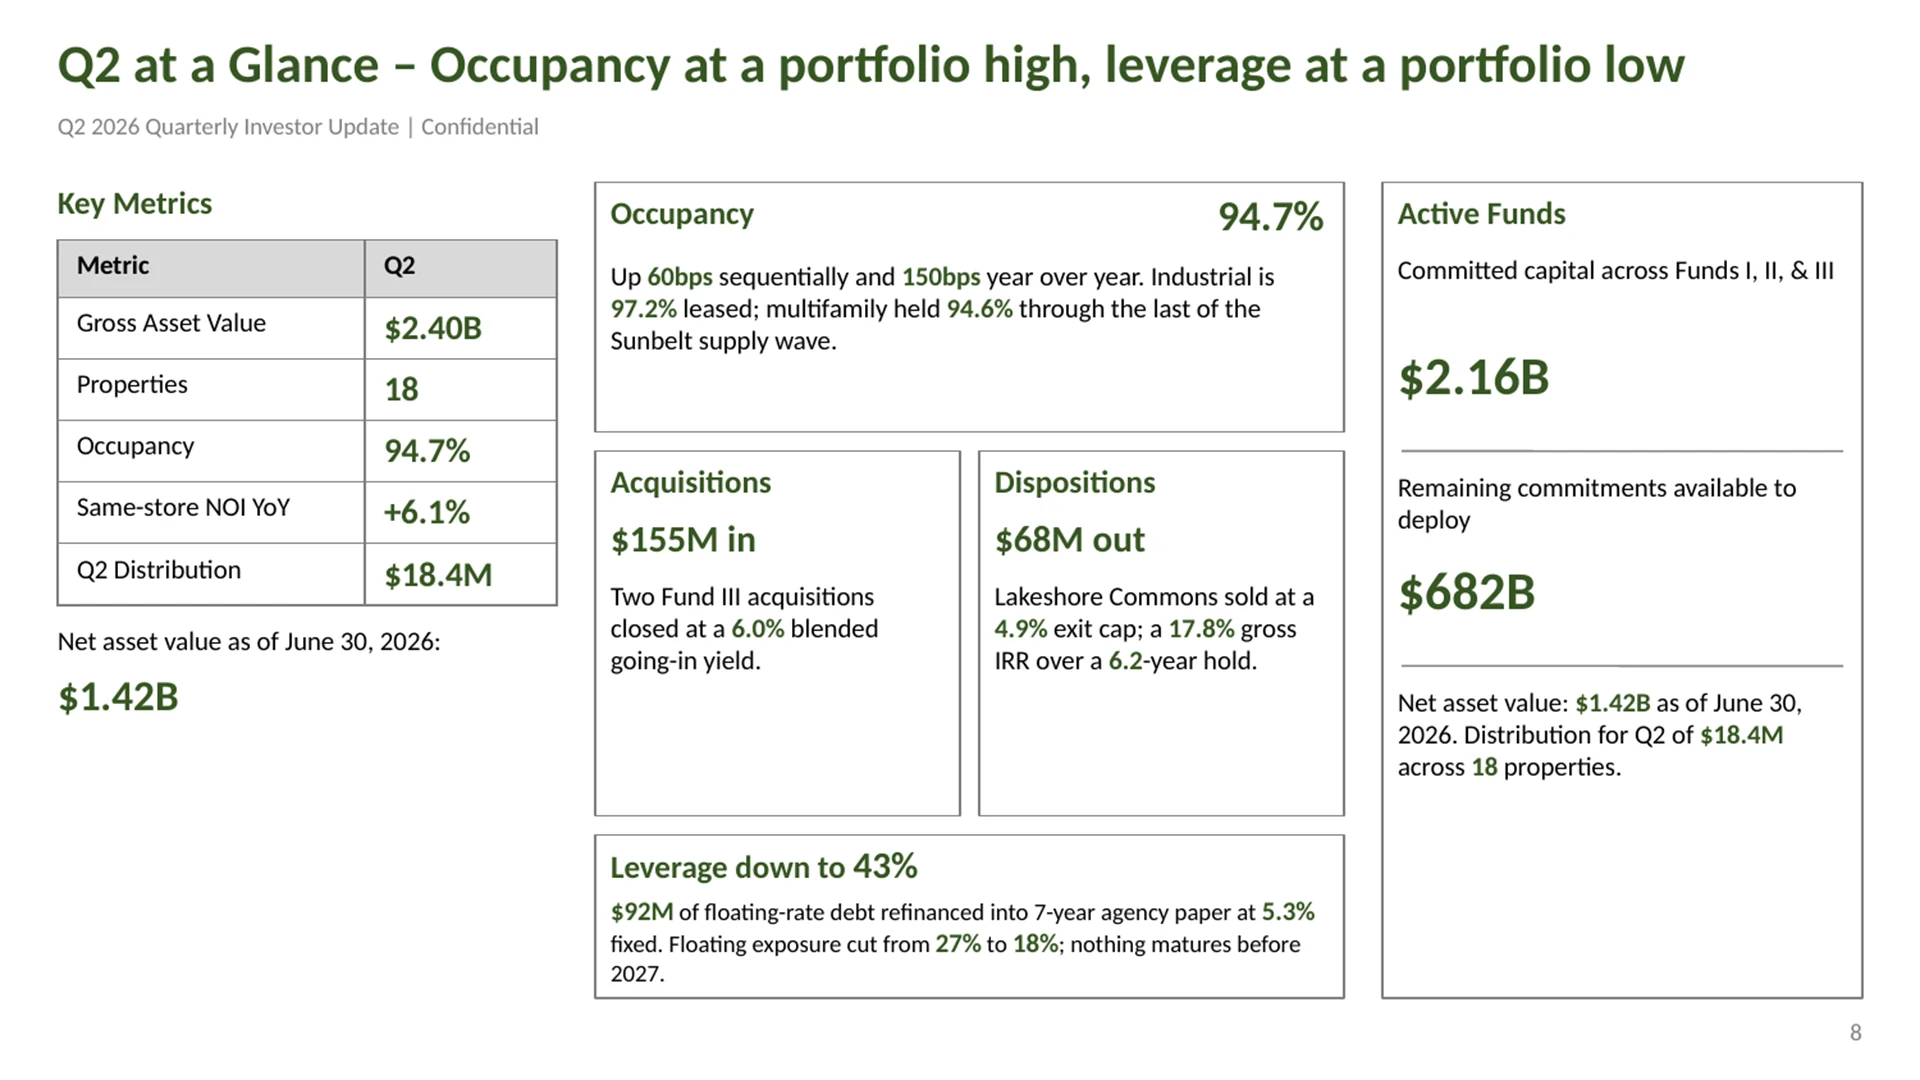
Editable Components
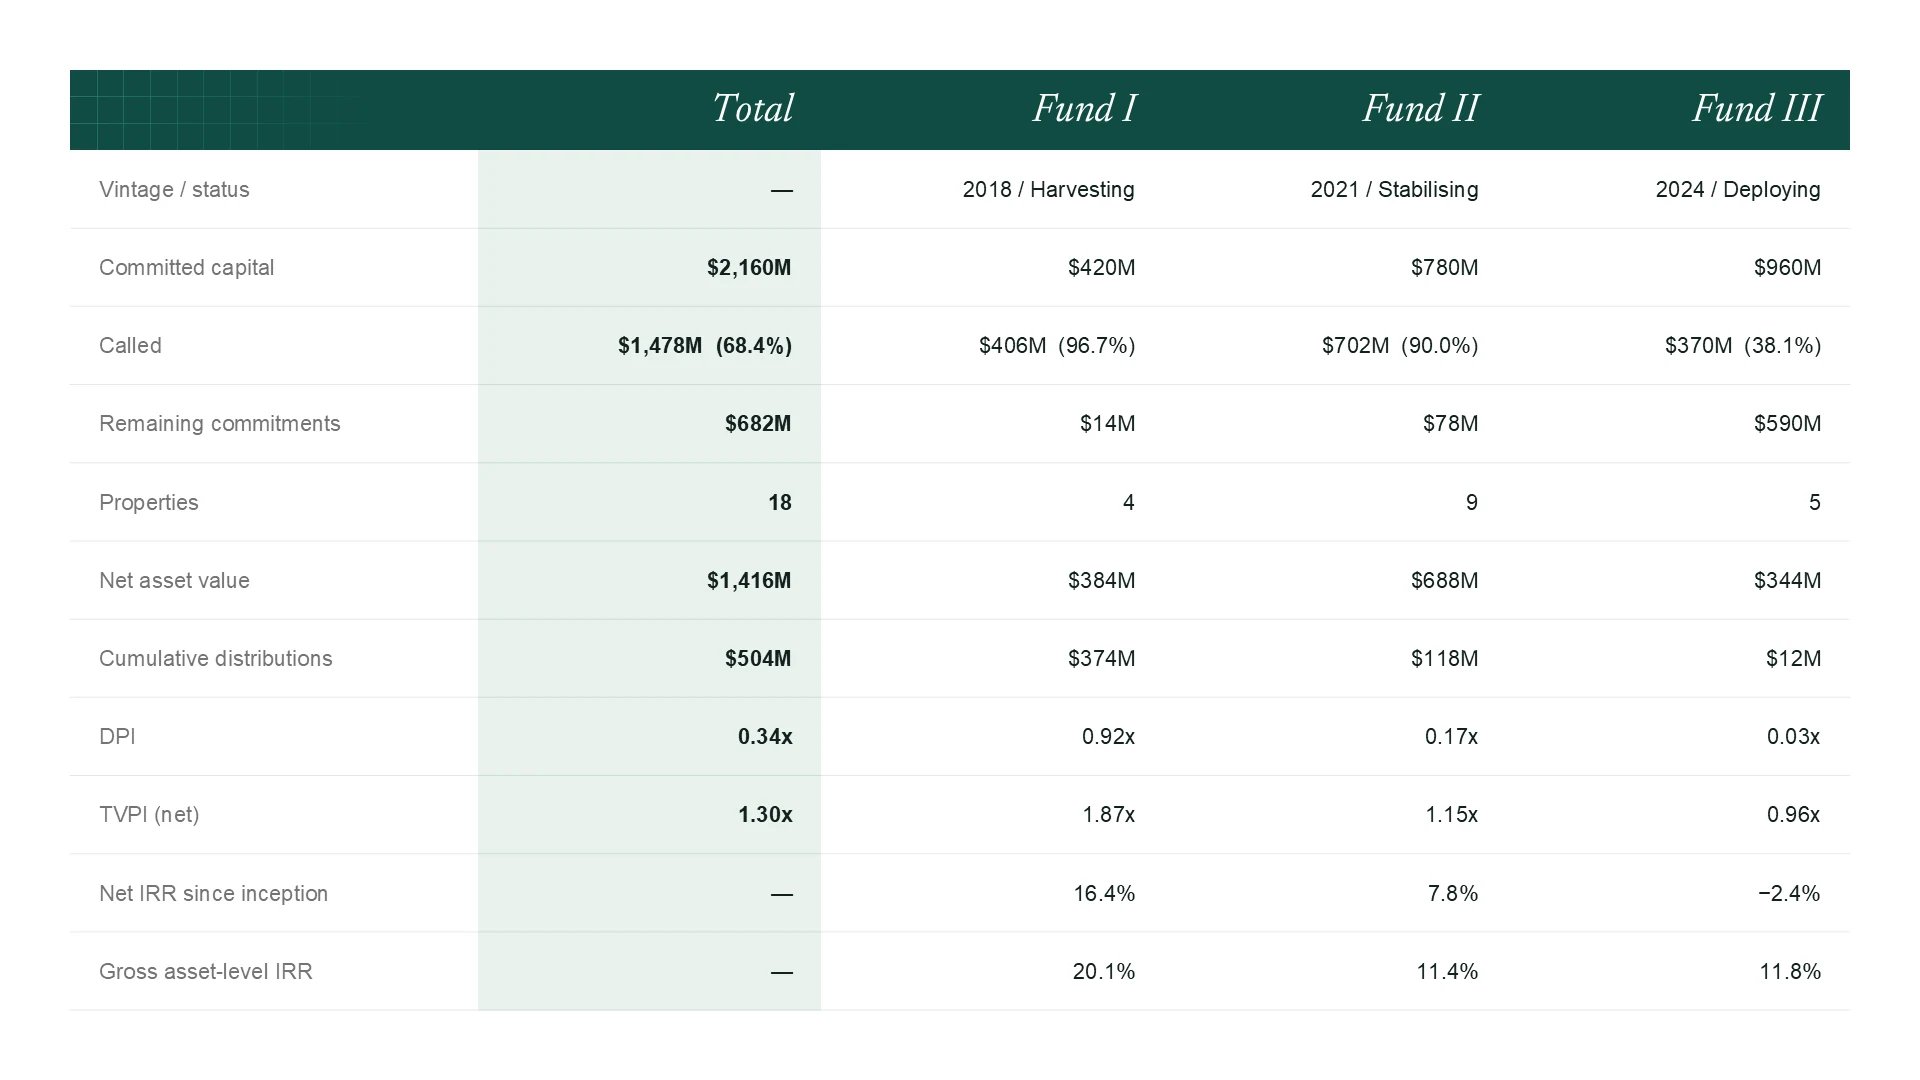
A quarterly deck is never finished — it gets rebuilt every three months. So every piece of it was made to be edited by the team, not redesigned. Charts, property cards, the map and the fund tables can all be updated with new numbers and photos without touching the layout.
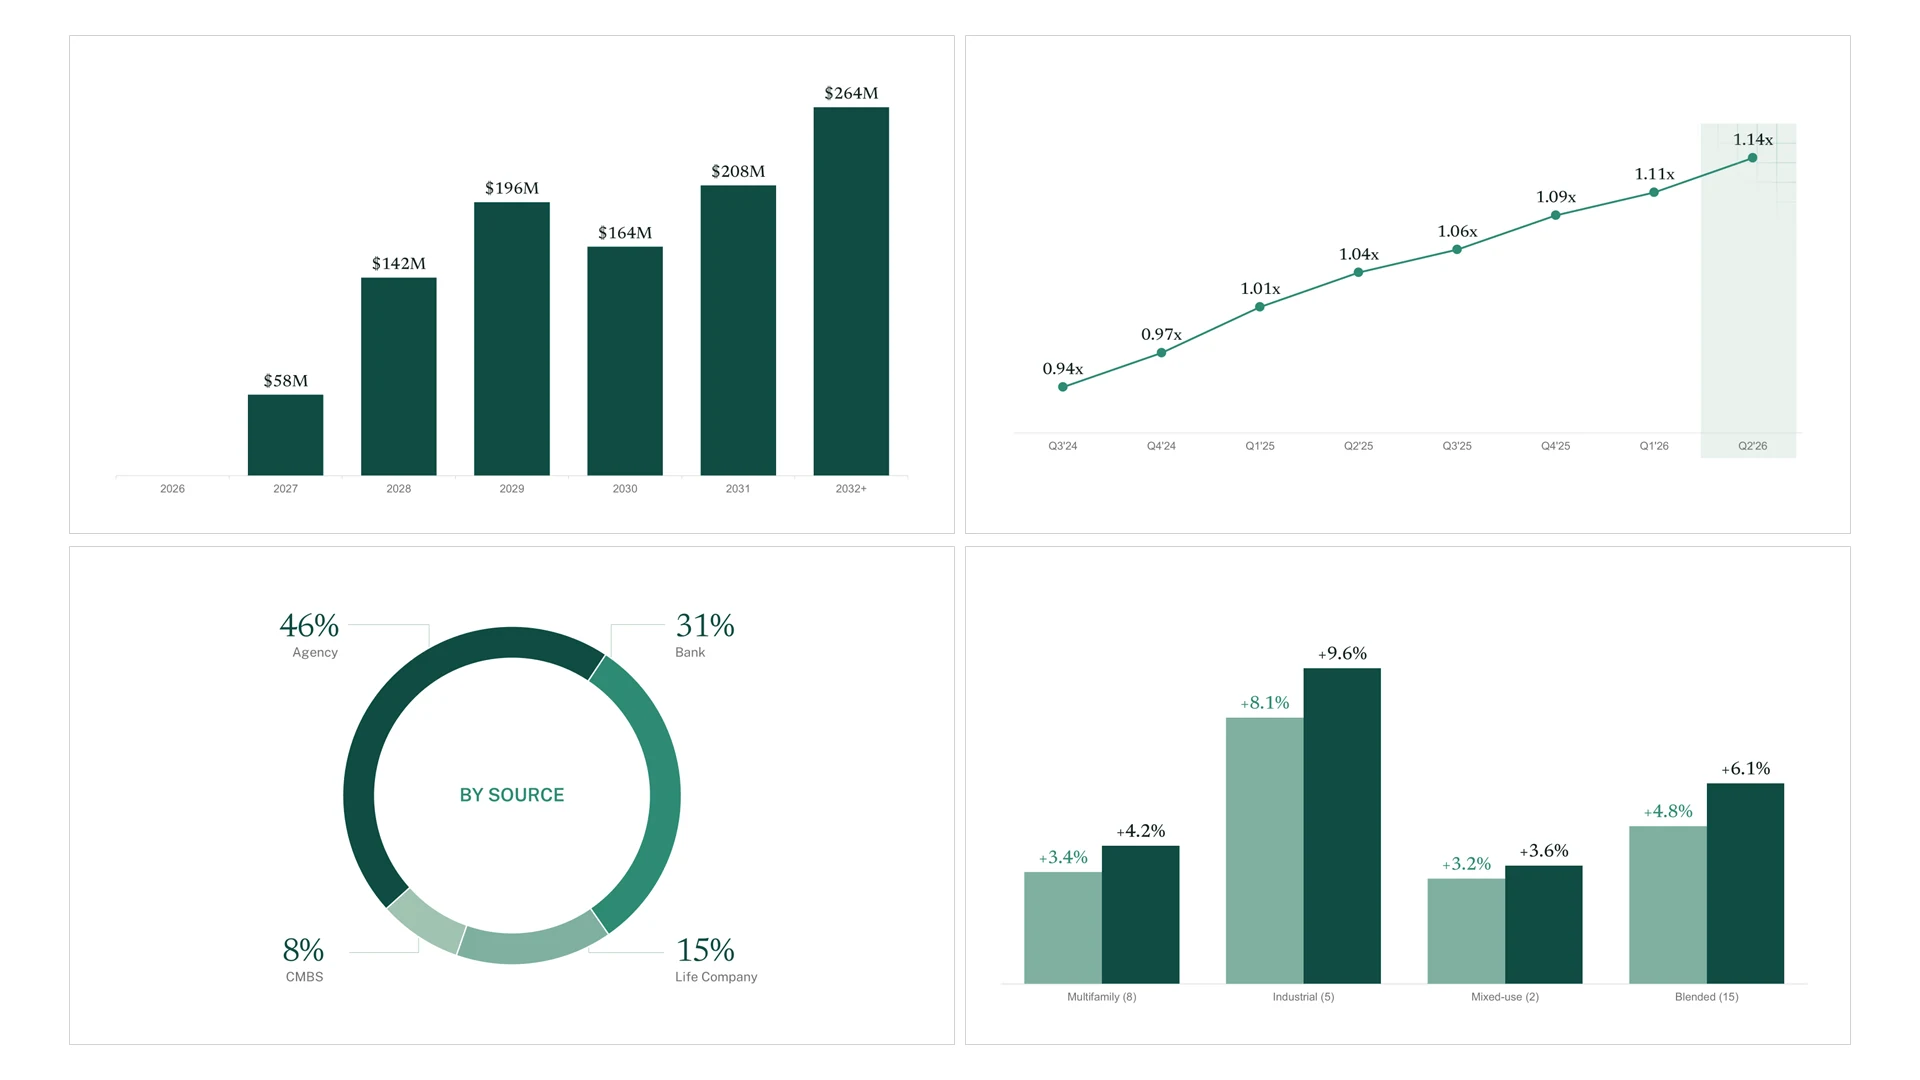
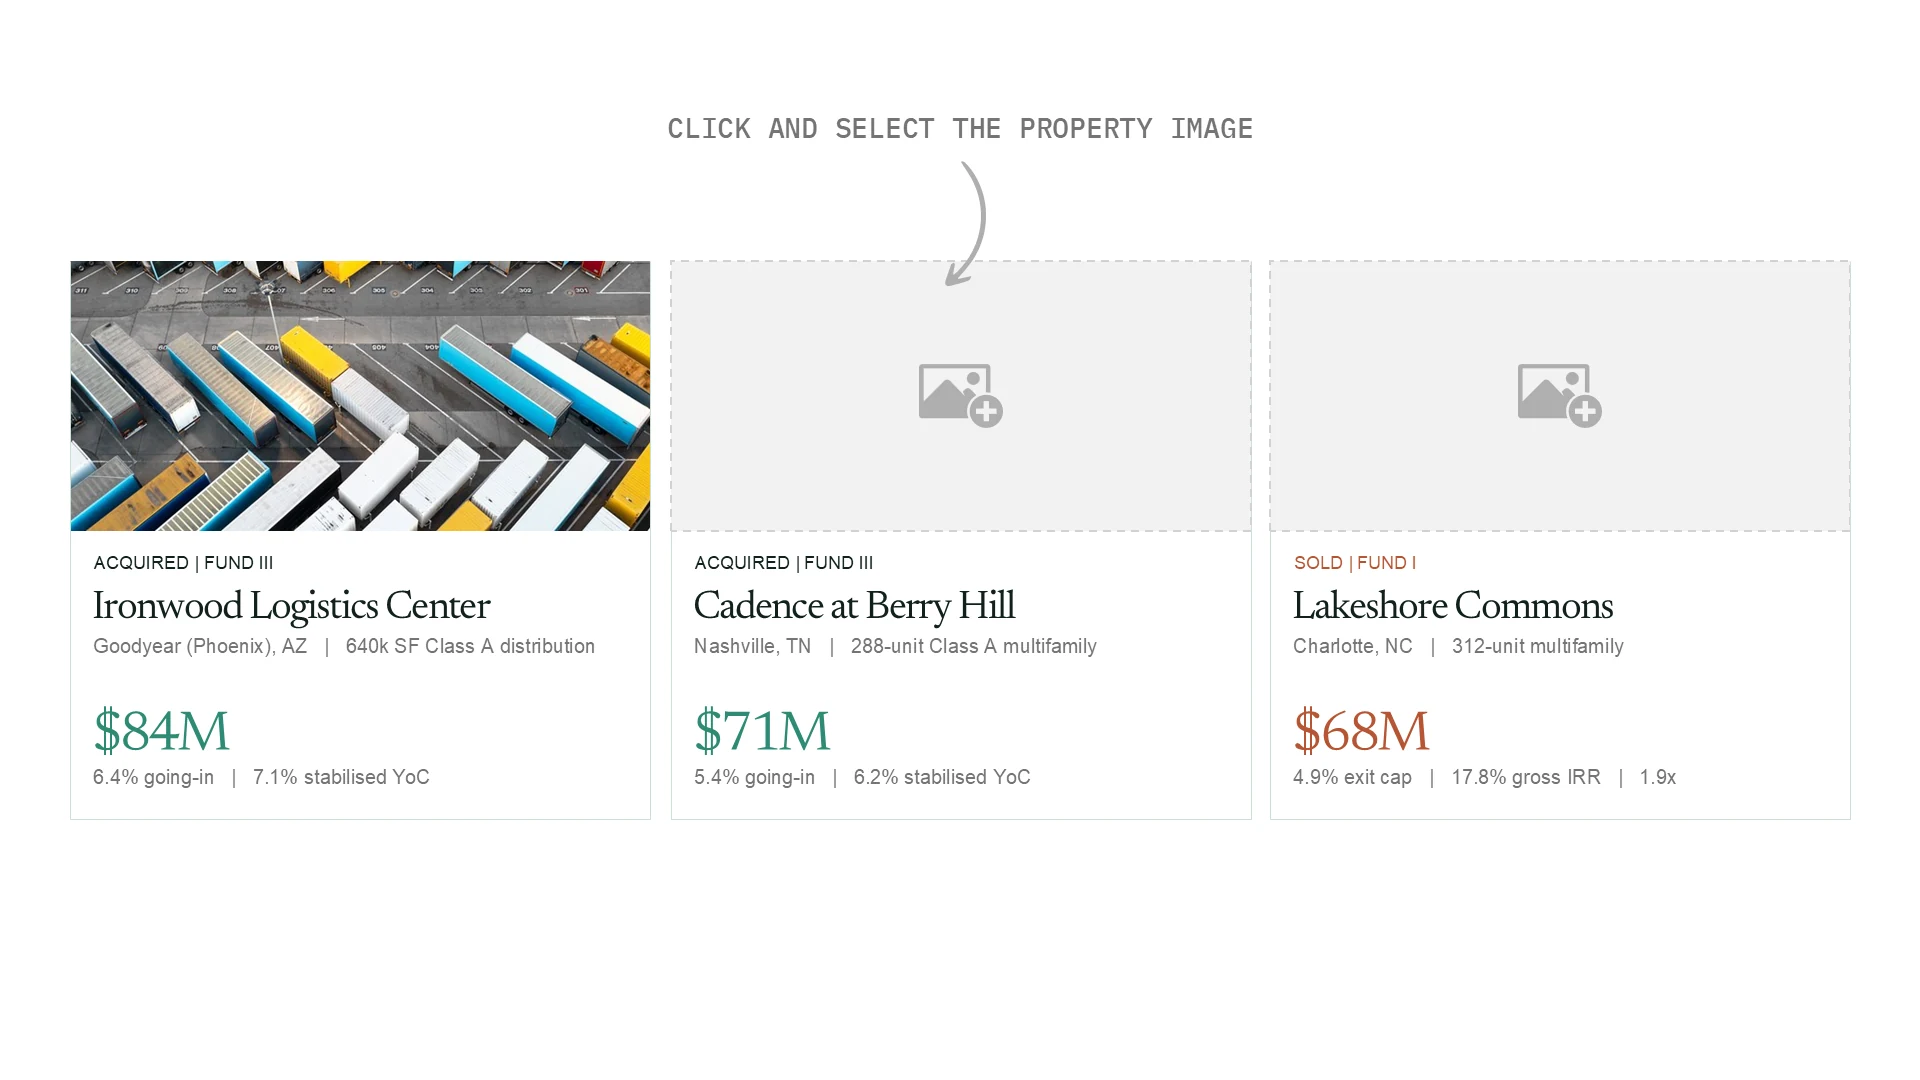
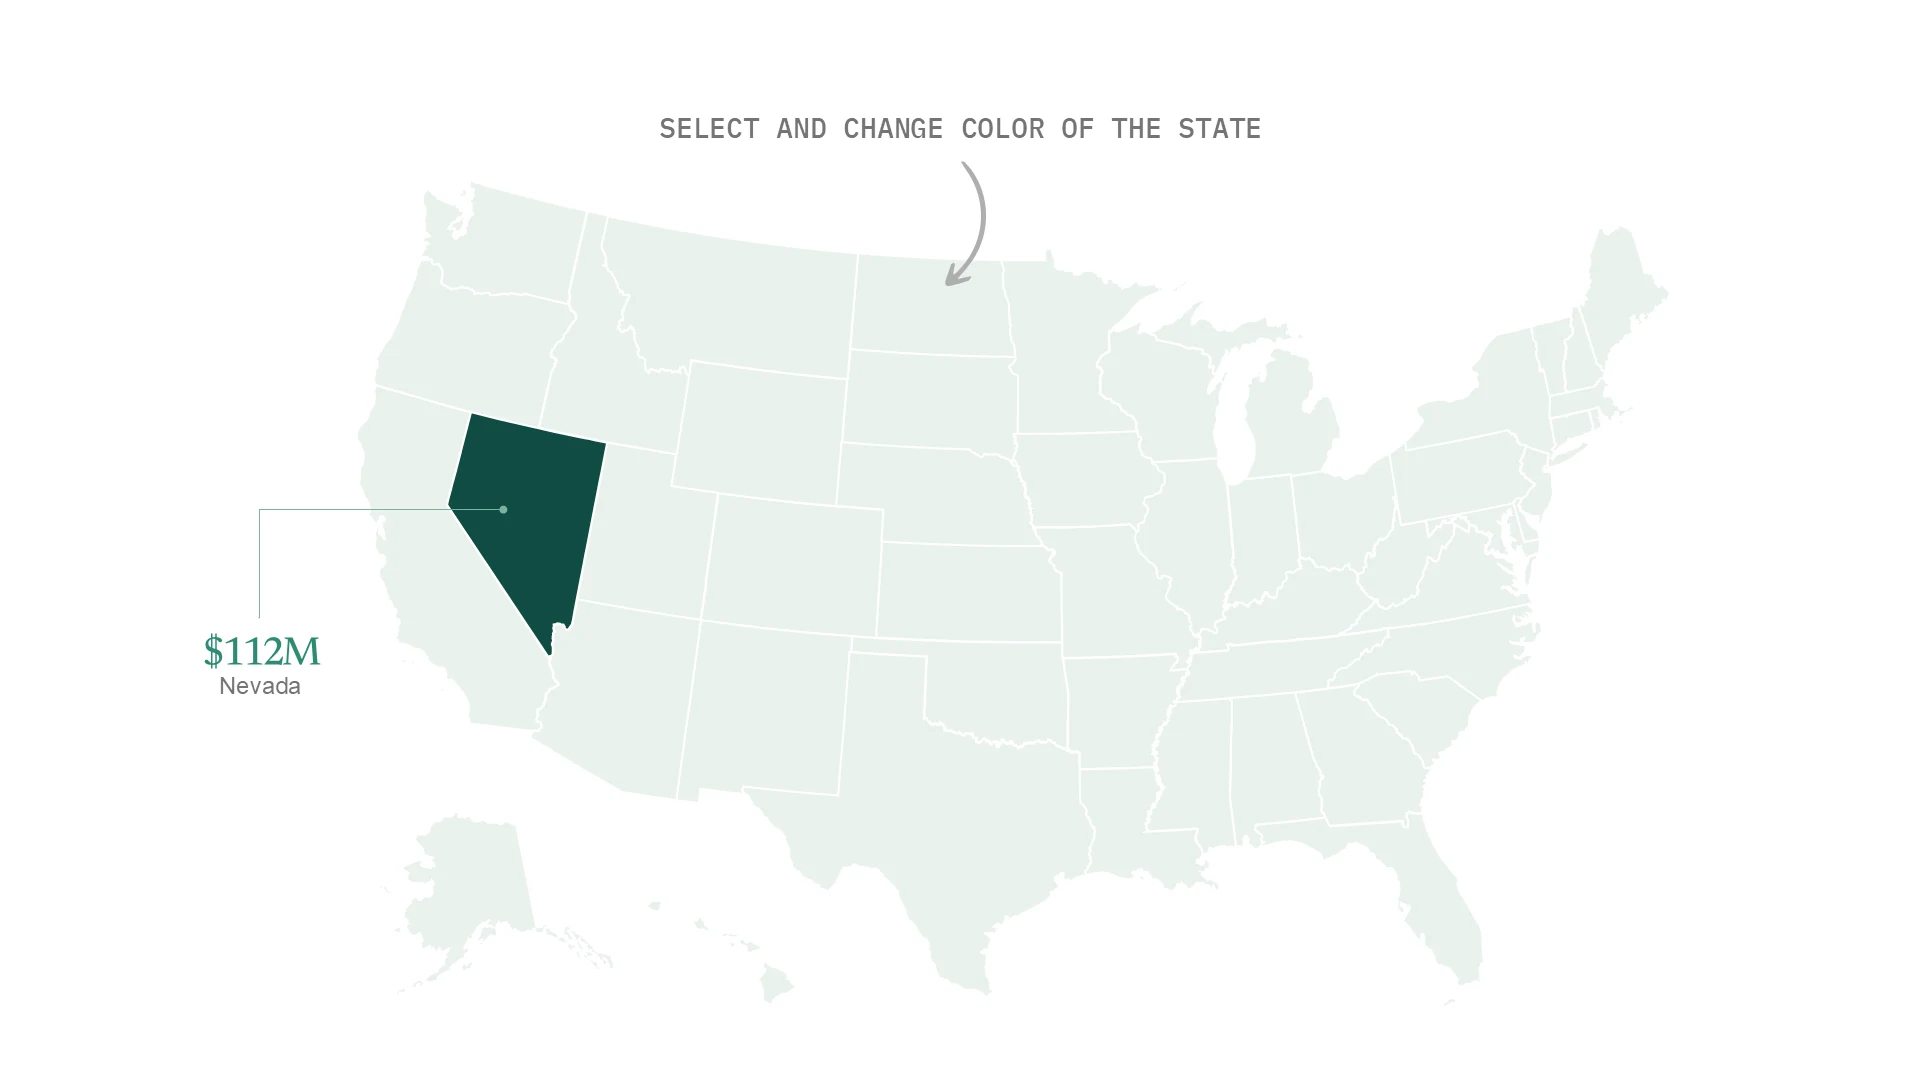
The Final Investor Presentation
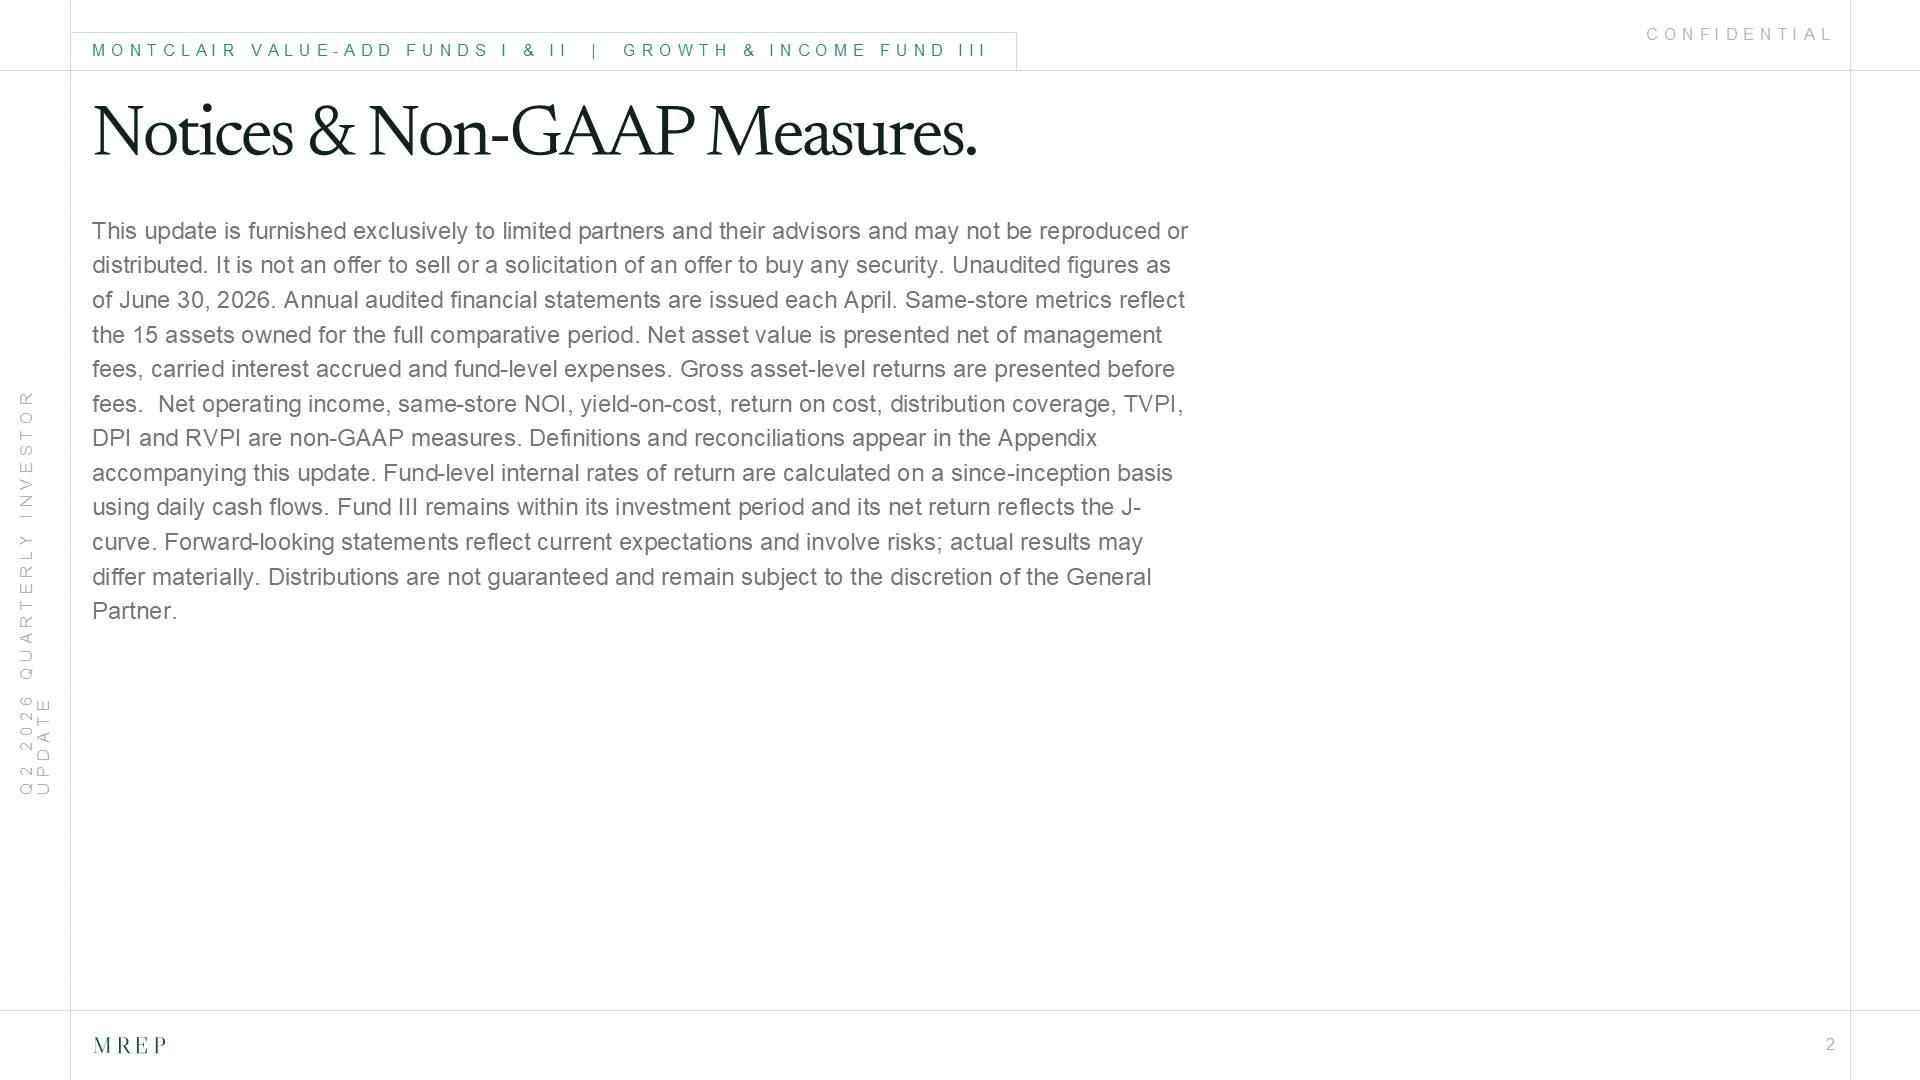
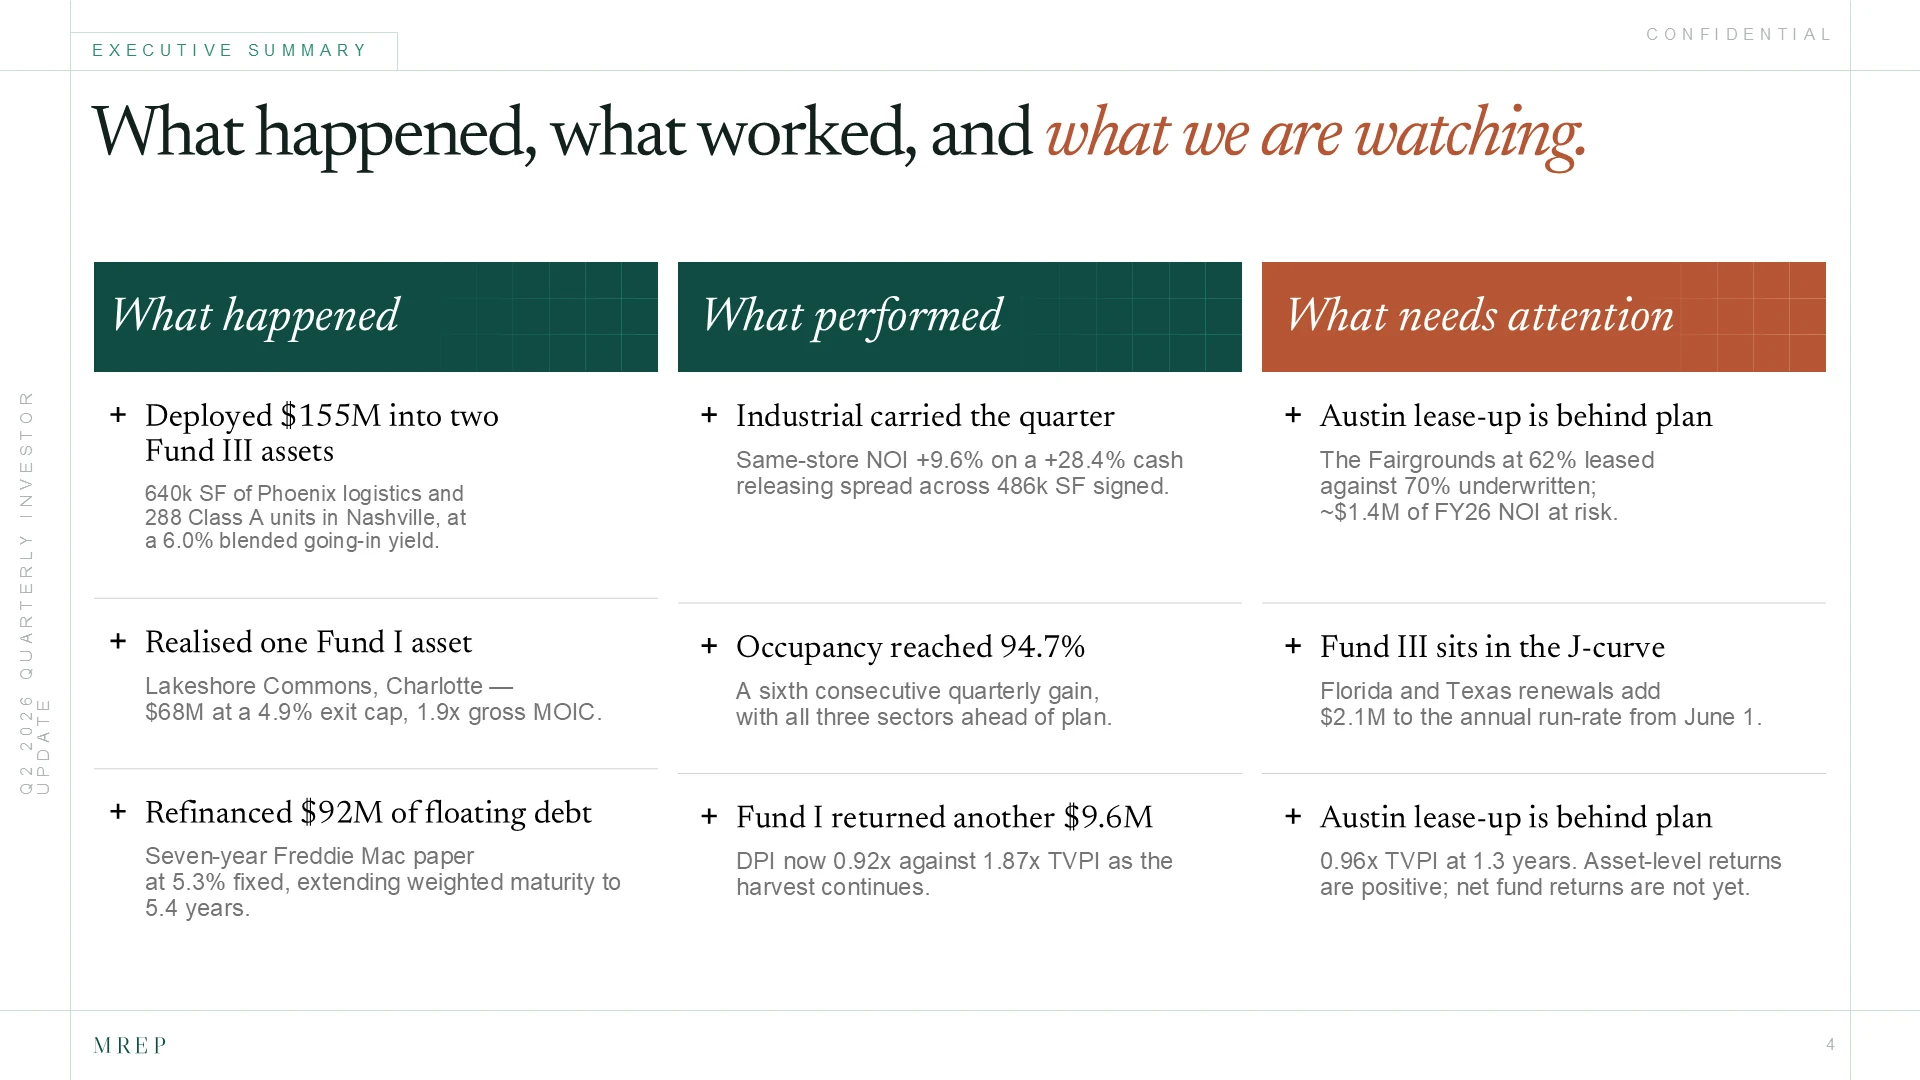
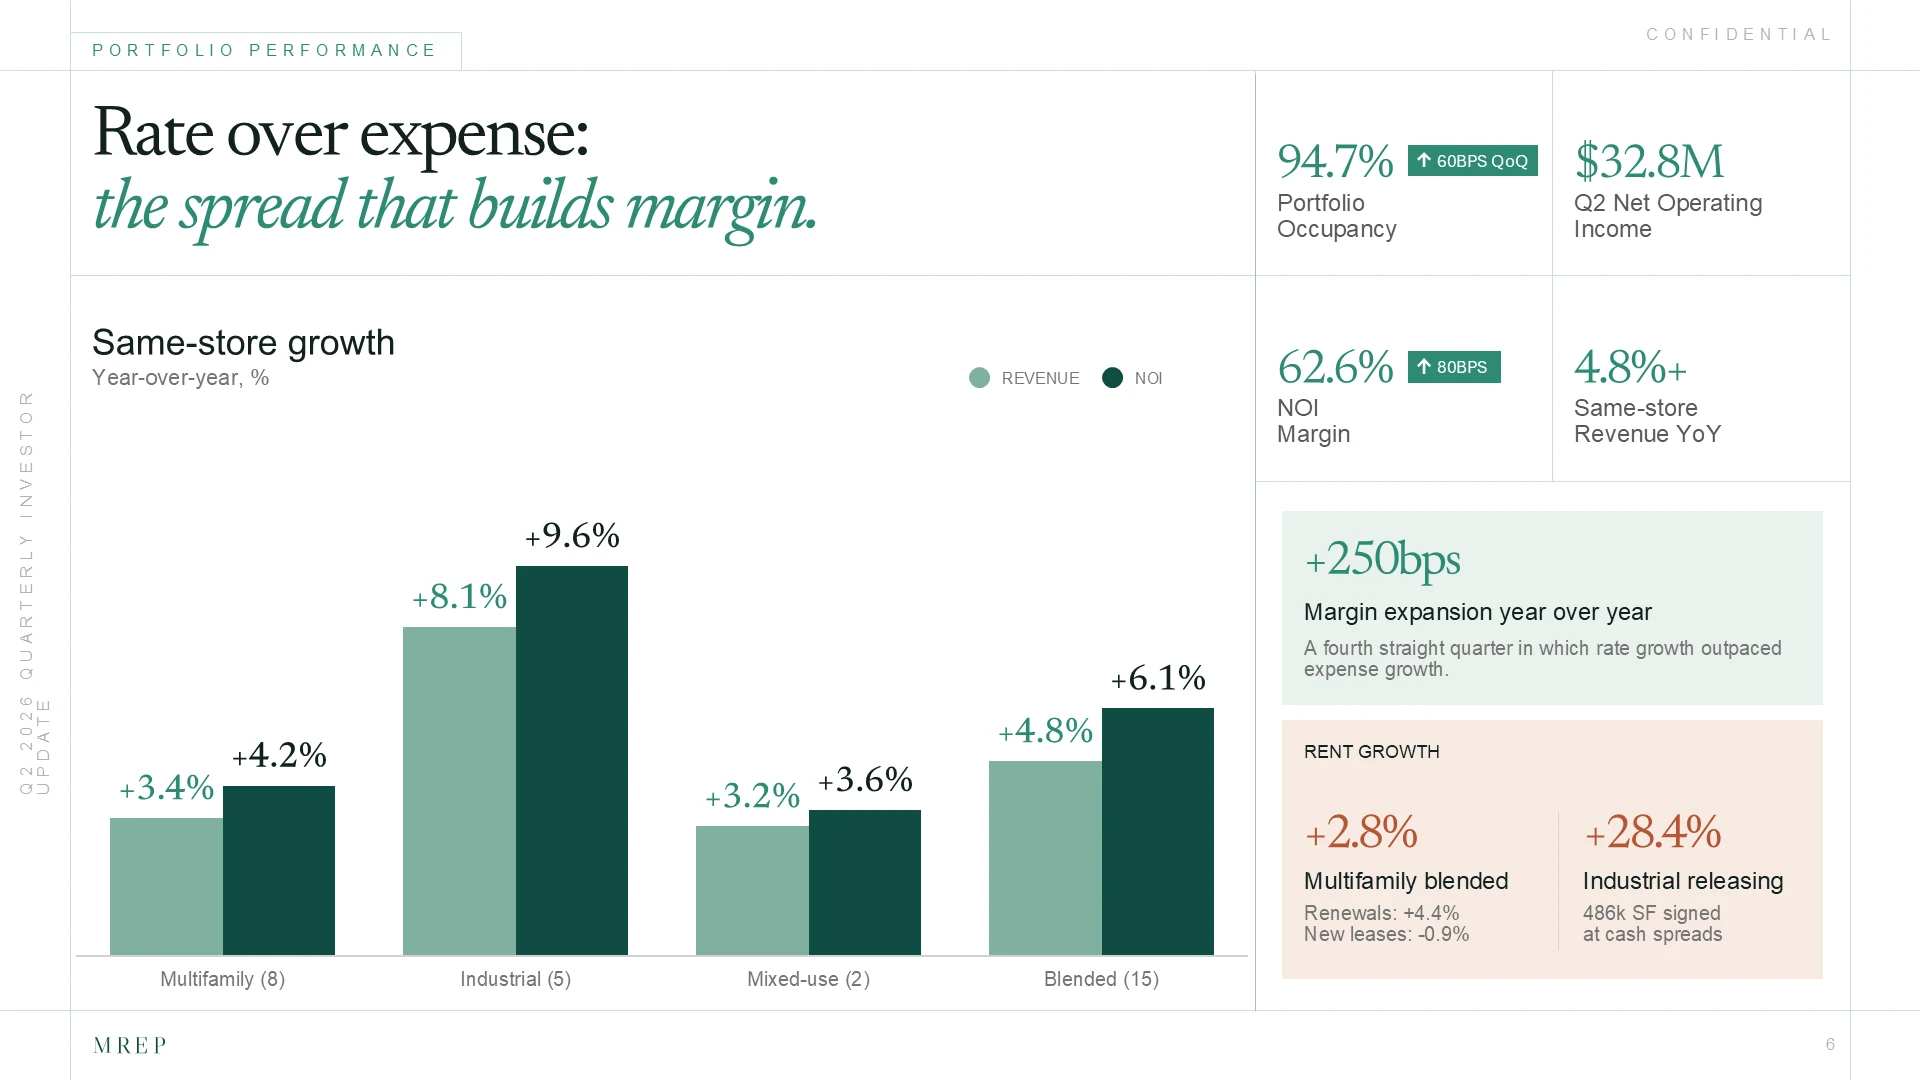
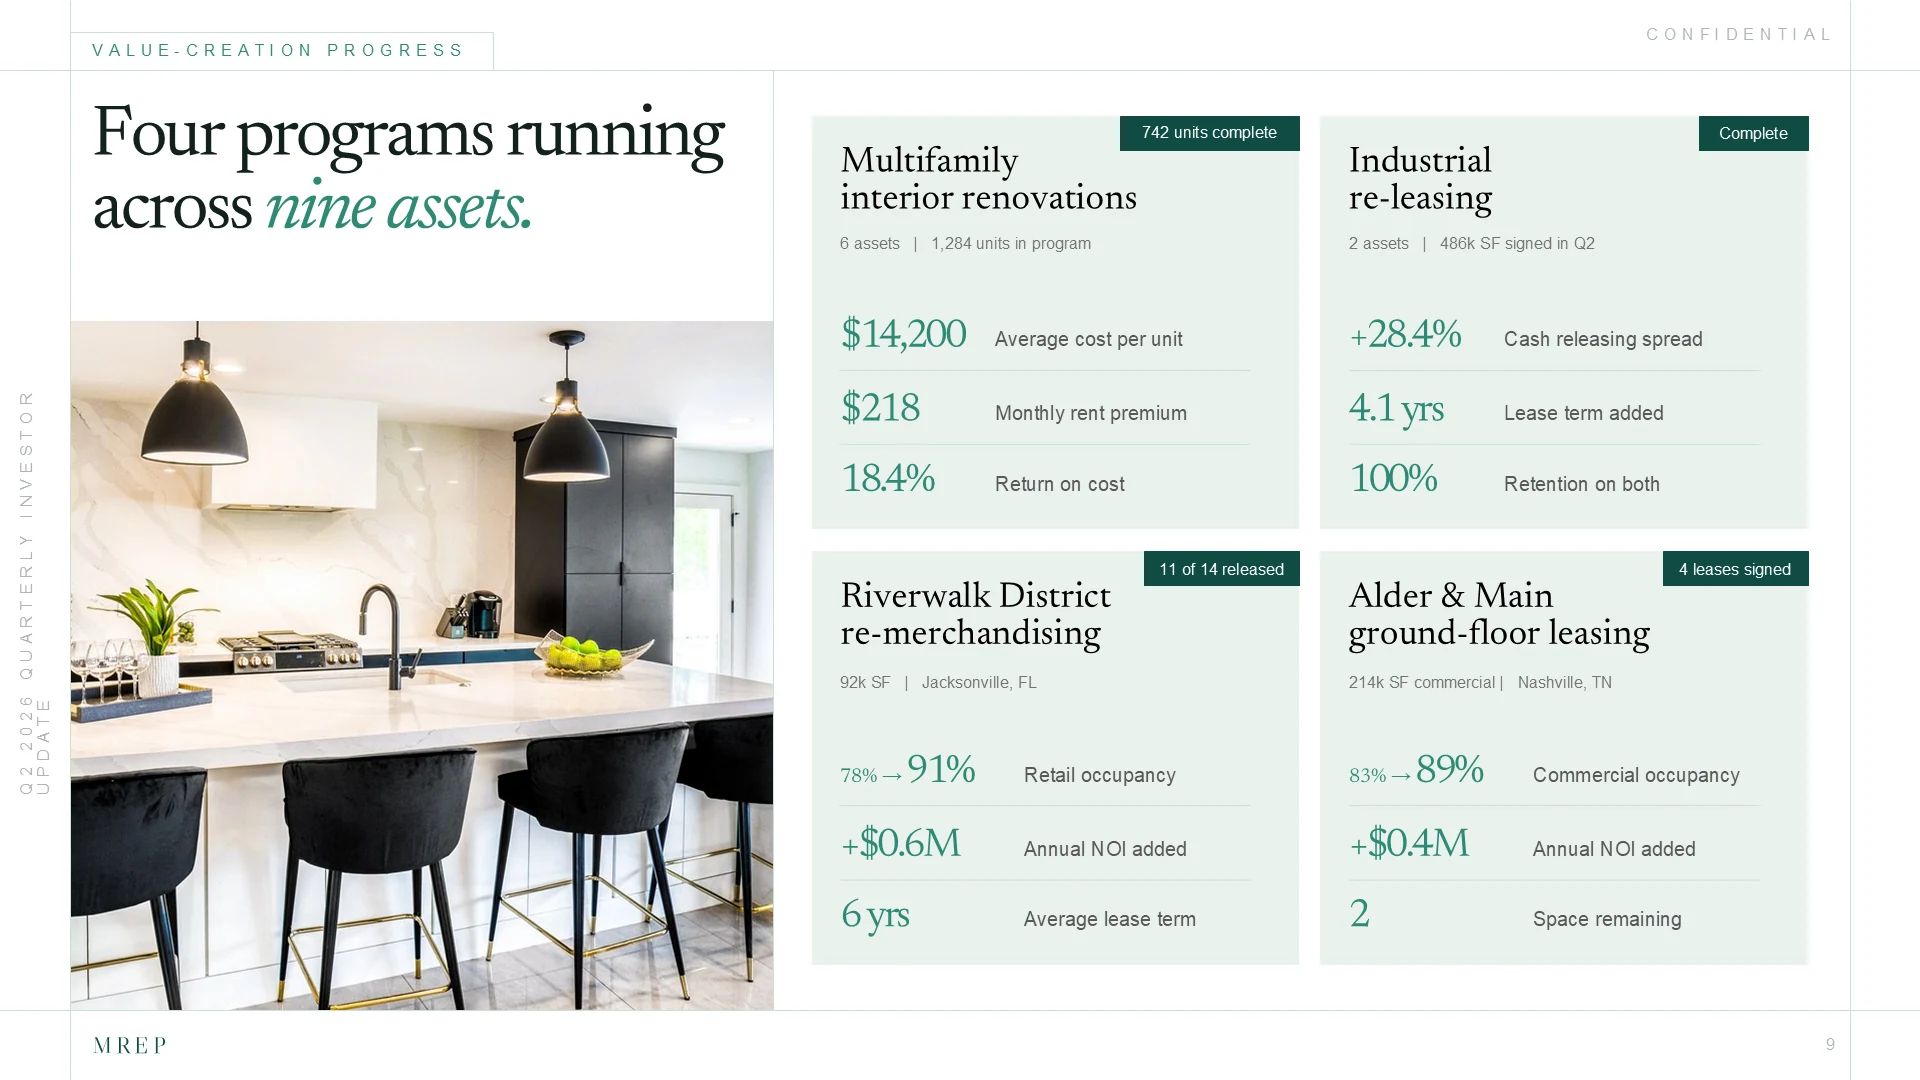
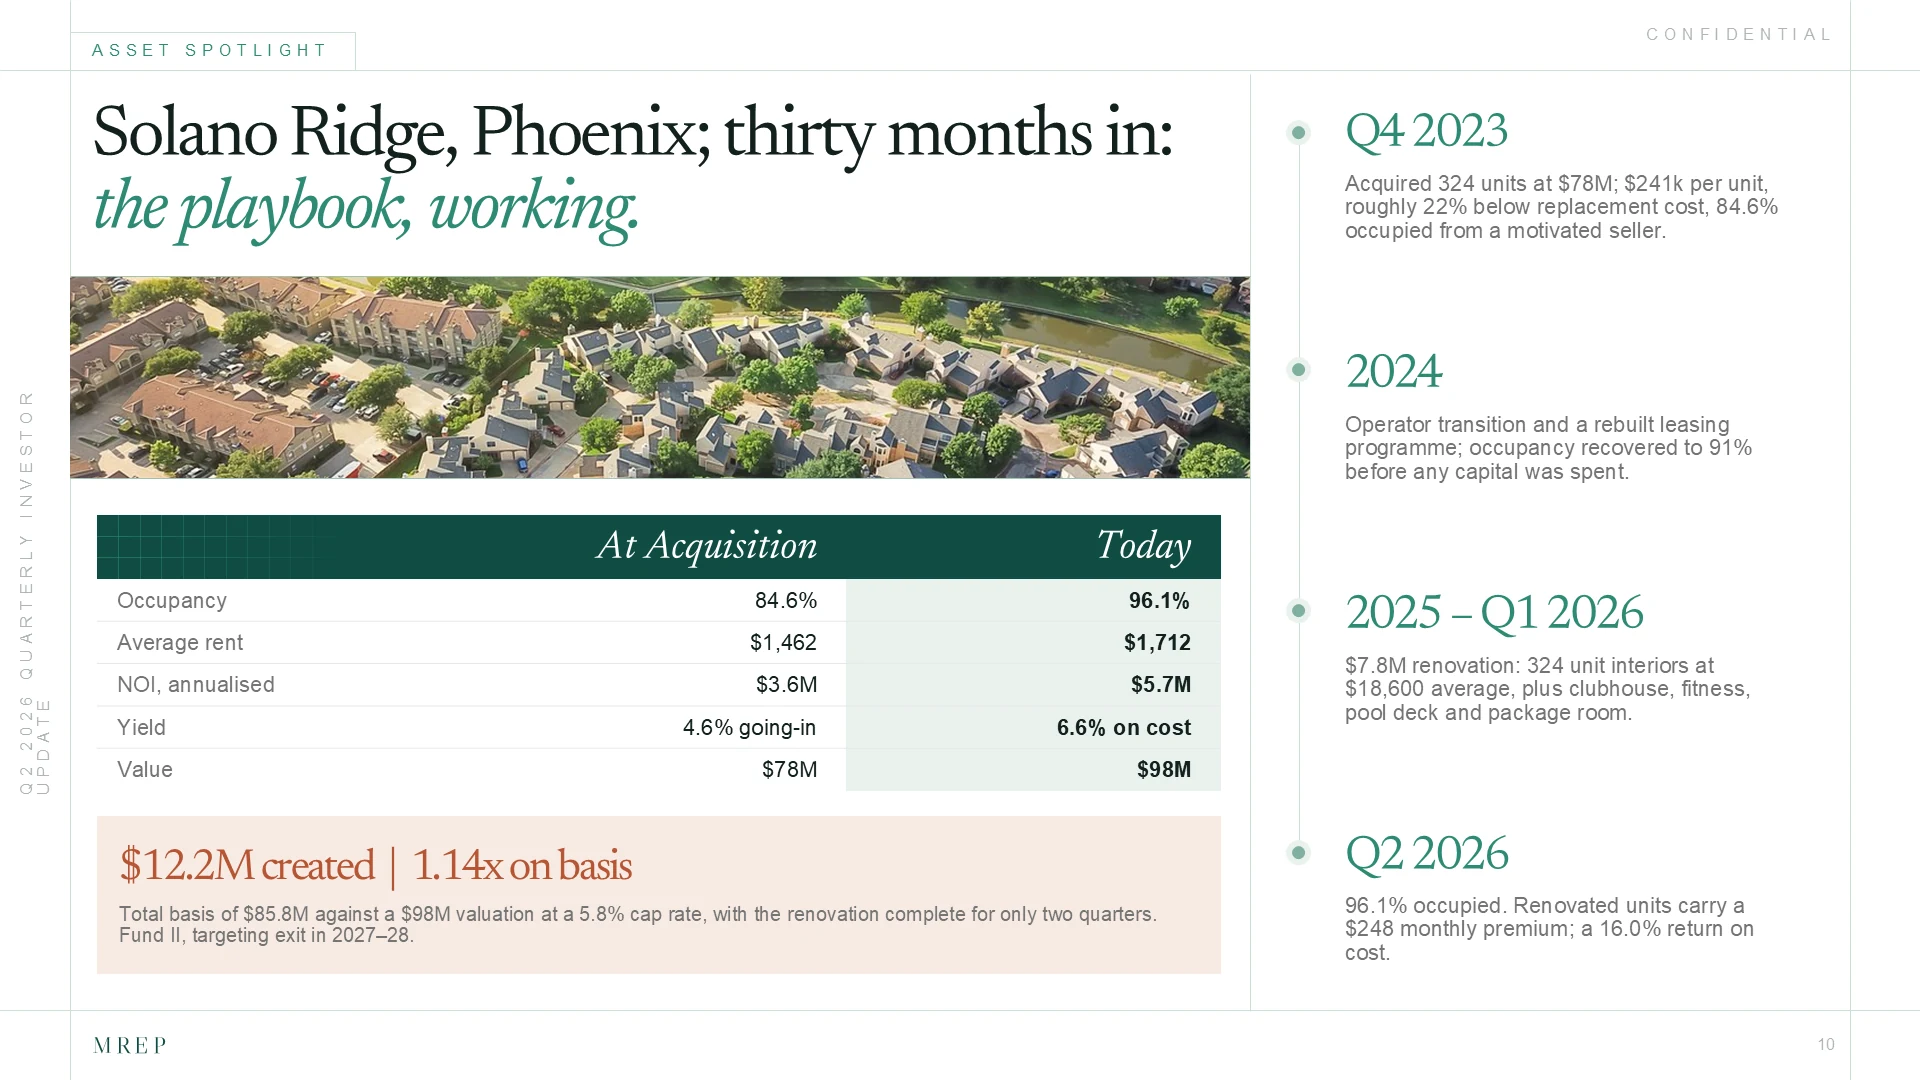
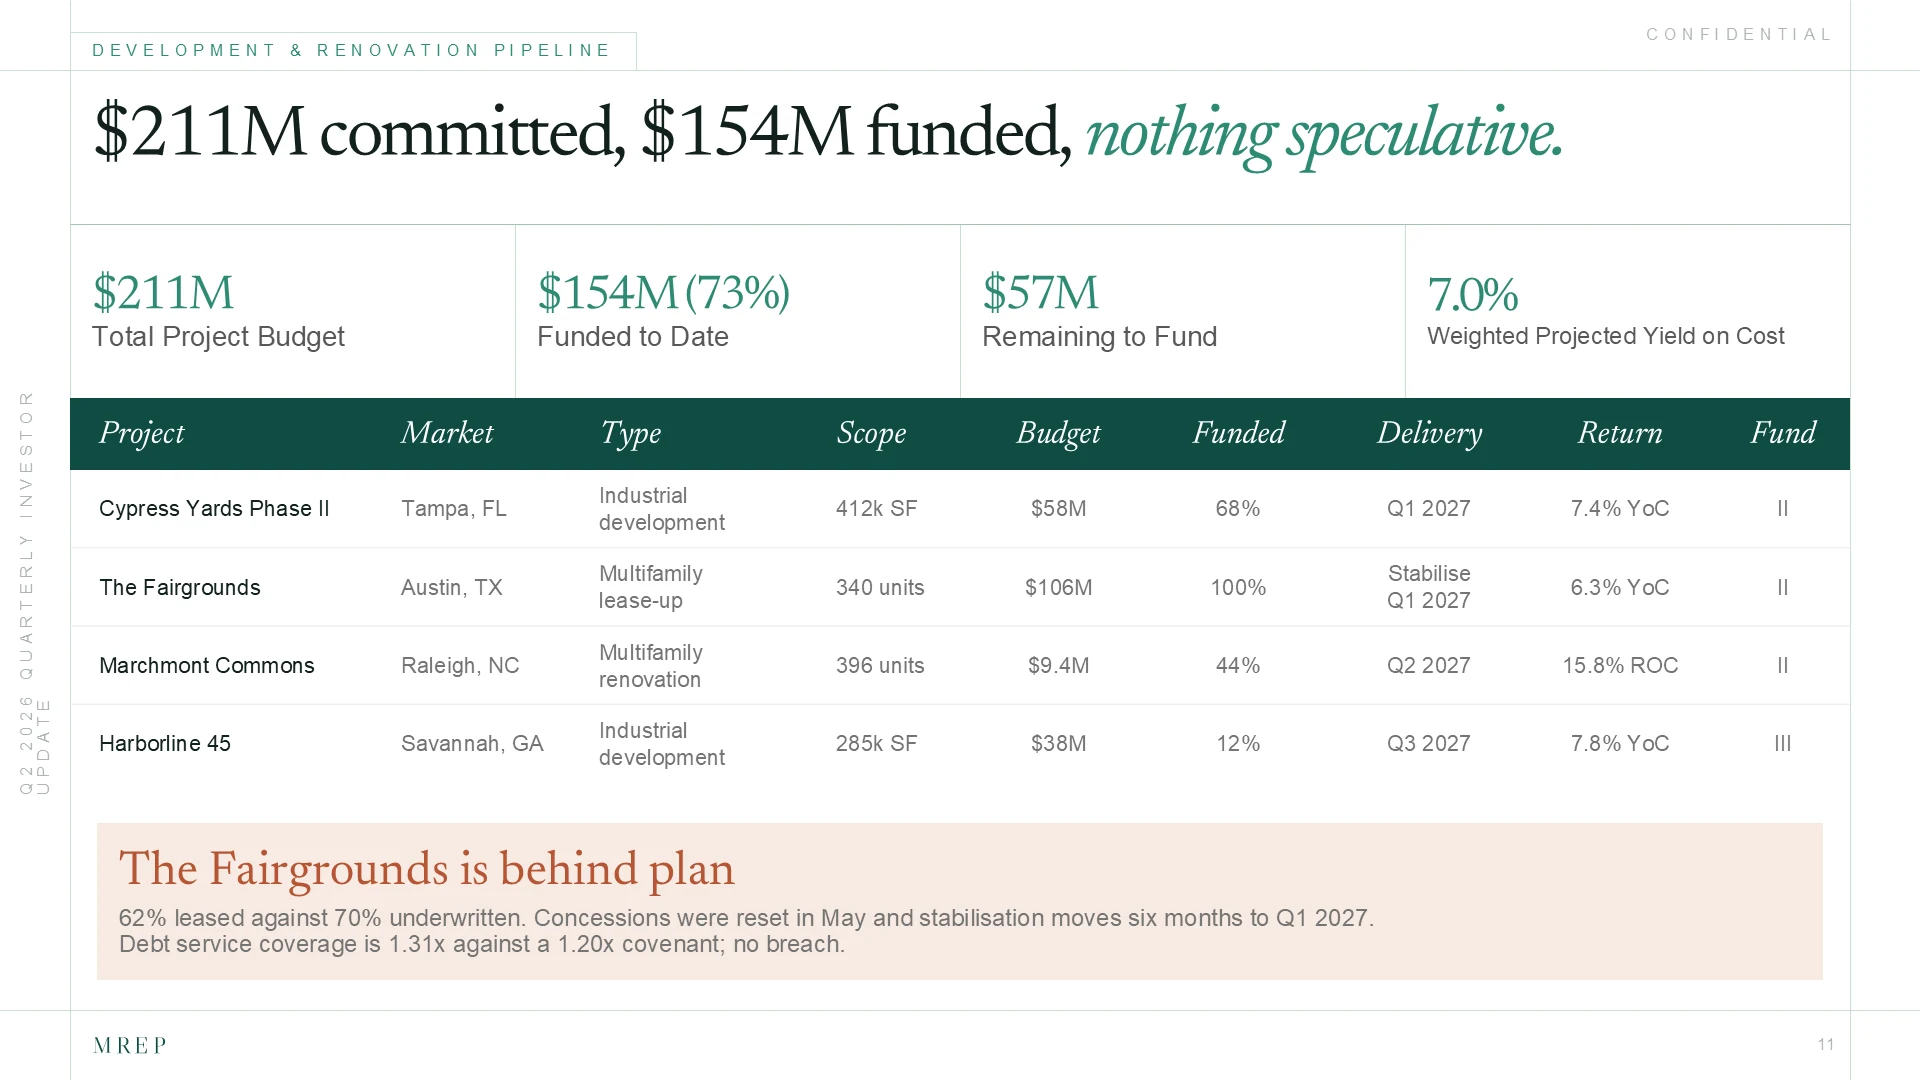
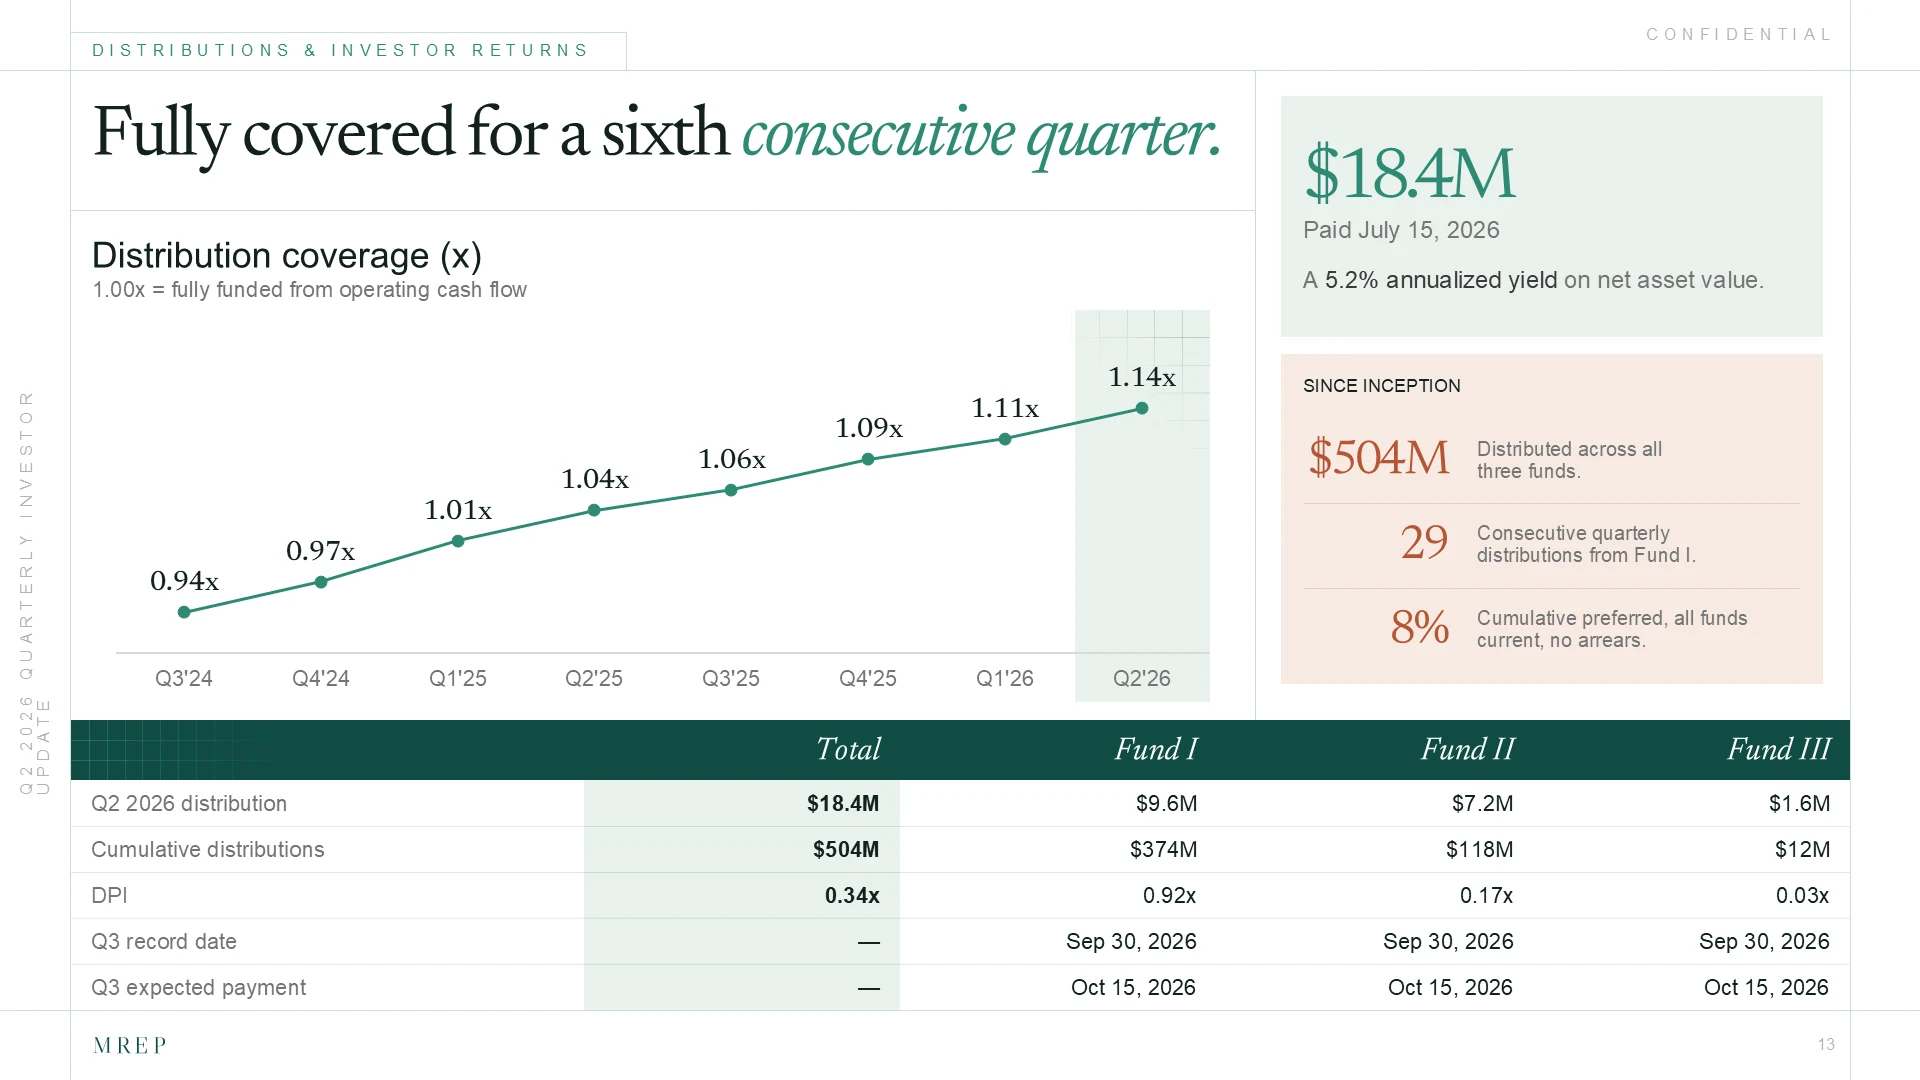
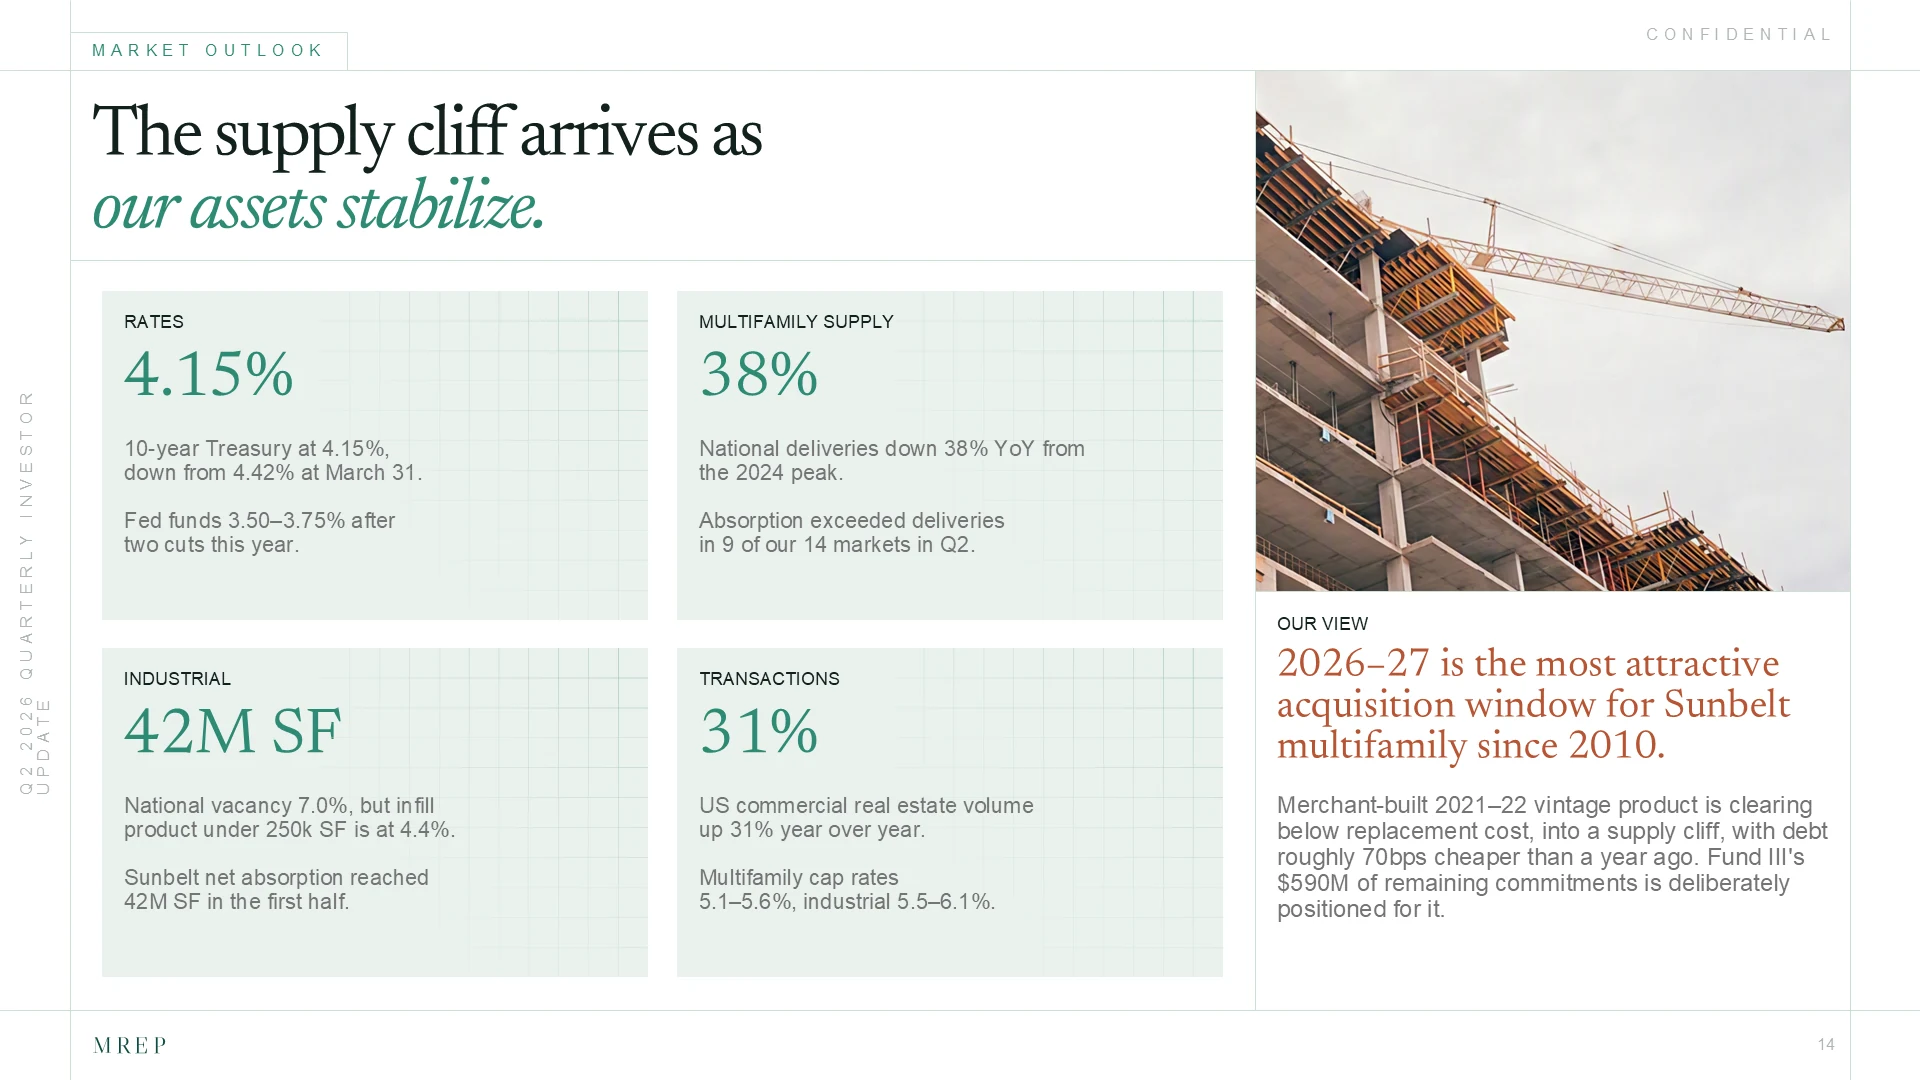
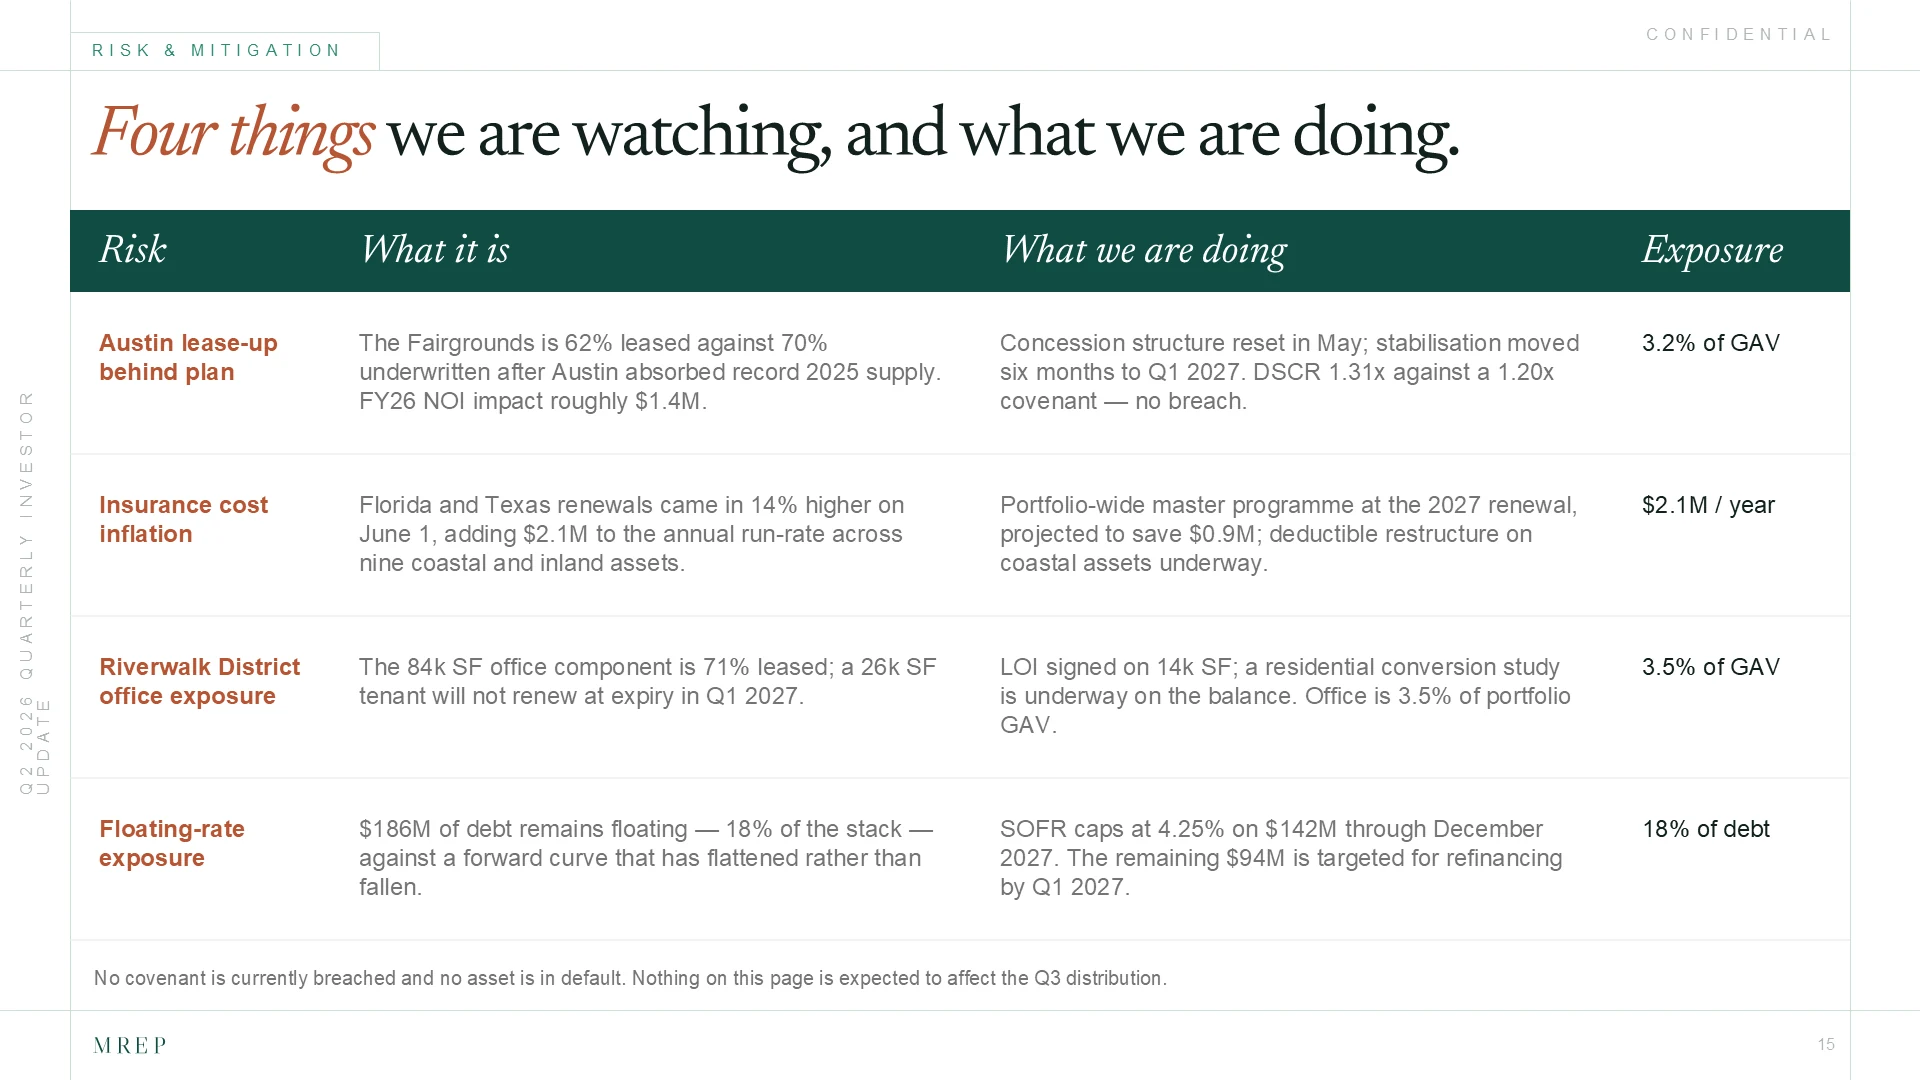
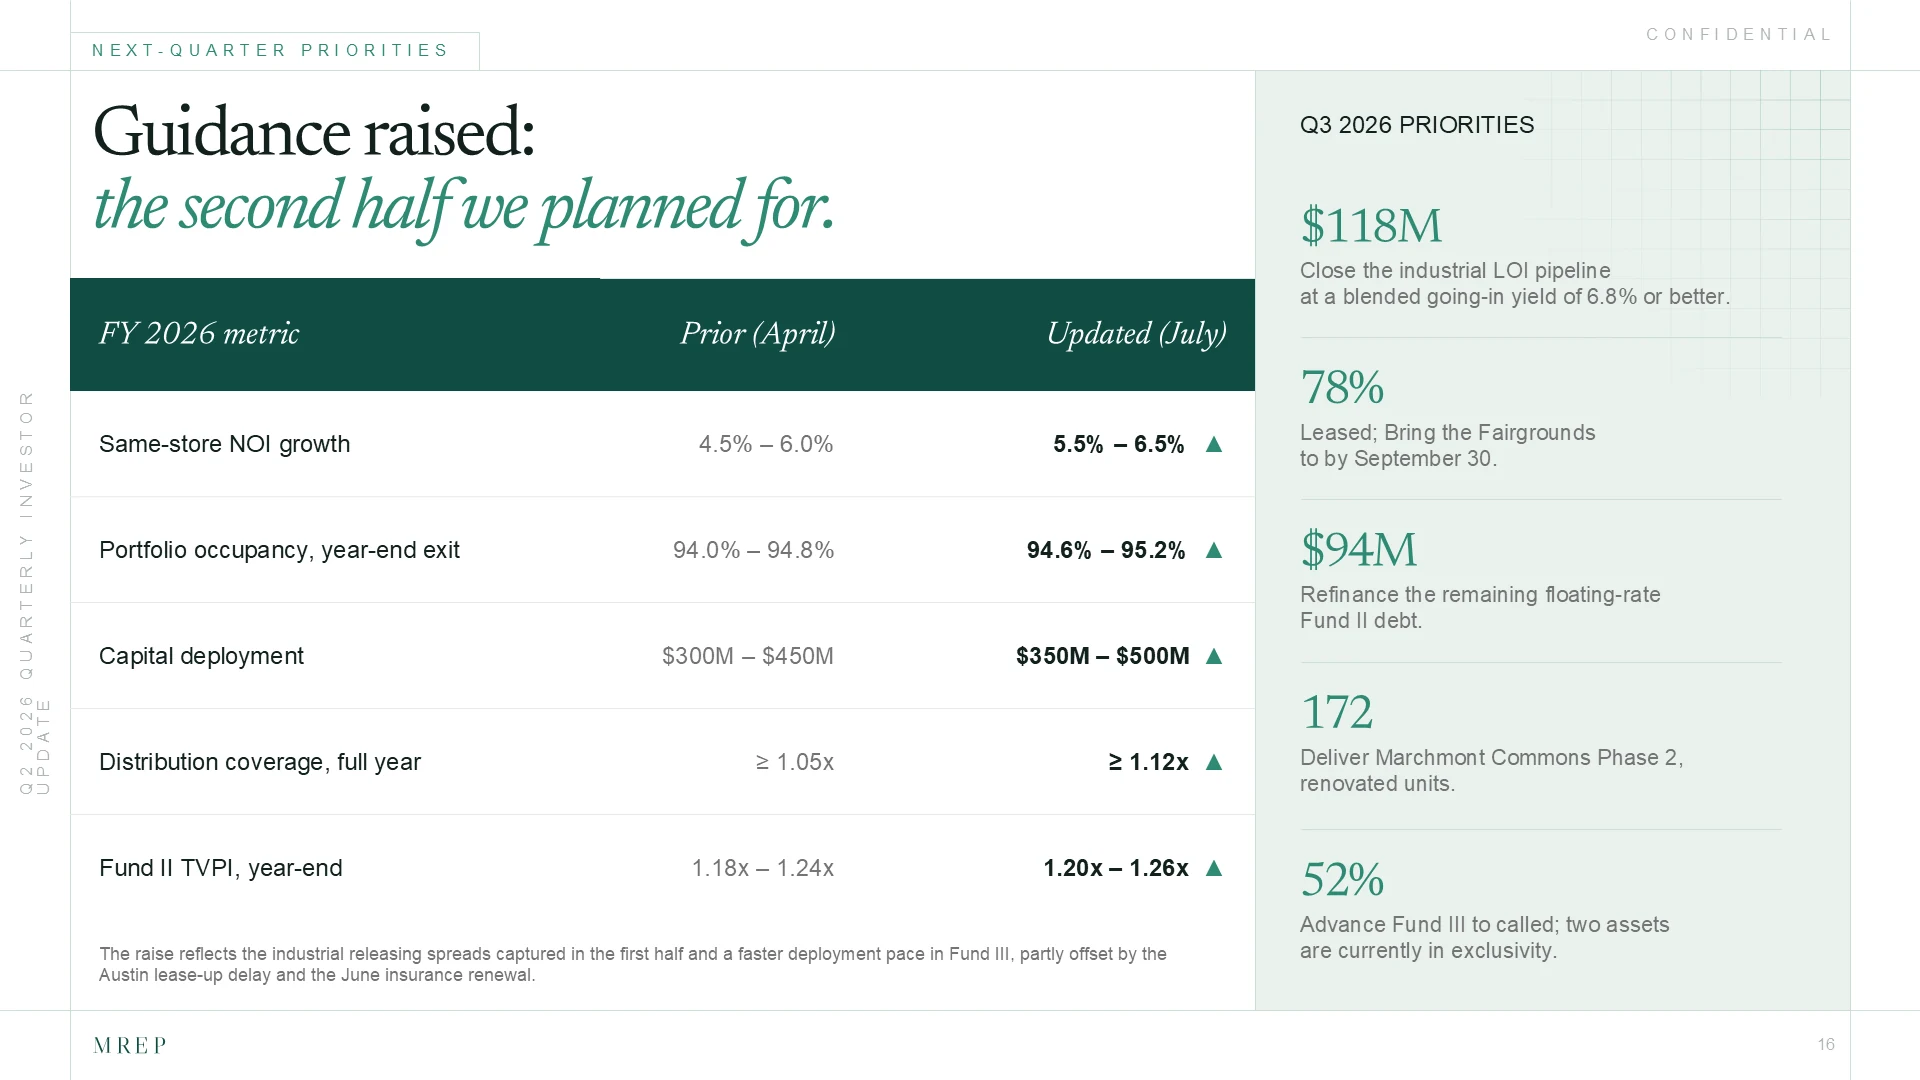
The finished deck takes an LP from the top-level fund numbers down to the individual properties behind them. It opens with a summary of the quarter, then moves through portfolio performance, debt and liquidity, distributions, and what the team plans to do next. Every section is built to the same visual standard, so the deck holds together from the first slide to the last.
The Final Handoff
A finished investor update, plus the design foundation to build the next one on.
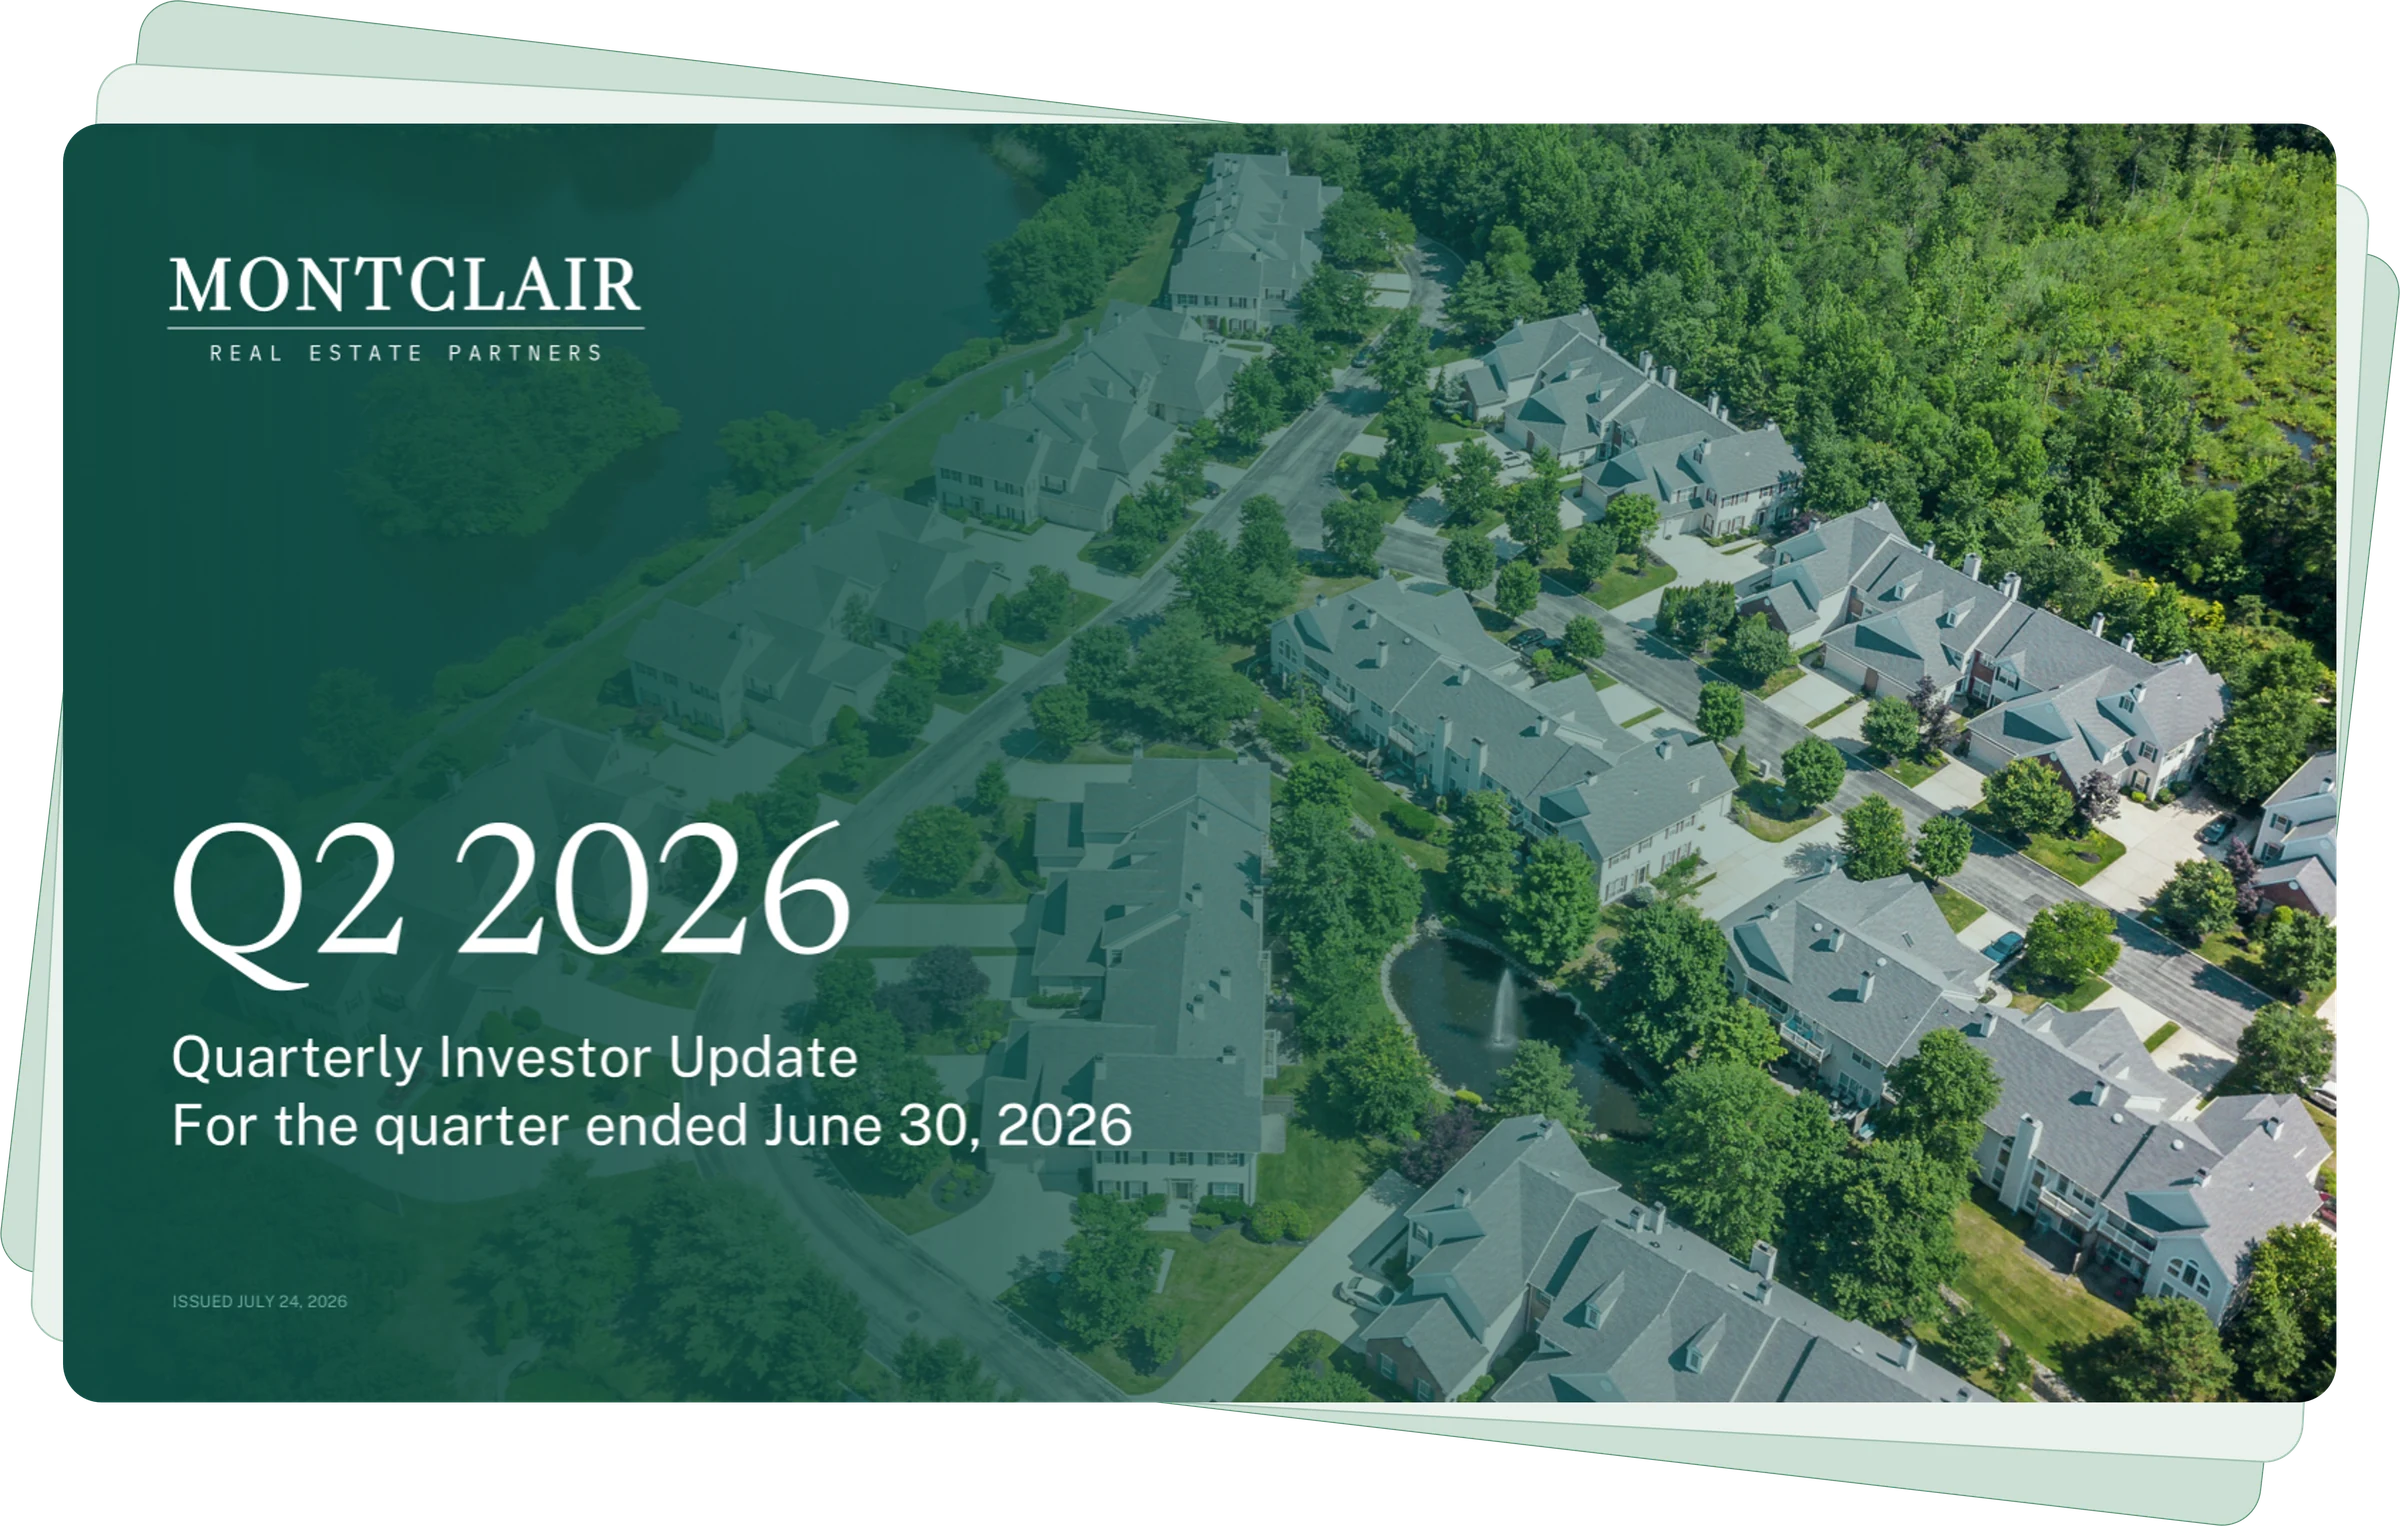
A complete presentation covering fund results, portfolio performance, asset activity, and what comes next.
The same typography, charts, tables, property imagery, and layouts across every slide.
Editable charts, cards, maps, and tables the team can update themselves next quarter.
 ChatGPT
 Google AI
 Claude
 Perplexity